Showing posts with label Greenland. Show all posts

Thursday, August 21, 2014

Changes in the Greenland Ice Sheet


Using 14.3 million measurements collected by ESA’s CryoSat mission between January 2011 and January 2014, researchers from the Alfred Wegener Institute in Germany have discovered that the Greenland ice sheet is shrinking in volume by 375 cubic kilometers a year. The study, which was published in a paper published on 20 August 2014 in the European Geosciences Union’s Cryospherejournal, also showed that Antarctica is losing about 125 cubic kilometers a year. Read full article.

Image credit: Helm et al., The Cryosphere, 2014

Note: For more information, see Greenland Ice-Sheet Height.

Saturday, June 14, 2014

Southwestern Coast of Greenland


On the southwestern coast of Greenland, multiple ice streams that drain the Greenland ice sheet are pictured in this satellite image.

Covering more than 2,000,000 sq km, Greenland is the world’s largest island and home to the second largest ice sheet after Antarctica.

Scientists used data from Earth-observing satellites have discovered that the rate of ice sheet melting is increasing. Between 1992 and 2012, Greenland was responsible for adding about 7 mm to the average global sea level. Many areas in Greenland – especially along the coast – are losing up to one meter of ice thickness per year.

Melting ice sheets caused by rising temperatures and the subsequent rising of sea levels is a devastating consequence of climate change, especially for low-lying coastal areas.

In addition, the increased influx of freshwater into oceans affects the salinity, which in turn impacts global ocean currents – a major player in the regulating of our climate.

In the lower part of the image, we can see icebergs speckling the waters of a fjord, with the mountainous Nuussuaq Peninsula visible along the bottom of the image.

This image was acquired by Landsat-8 satellite’s Operational Land Imager on 12 June 2013.

Image credit: USGS/ESA

Wednesday, March 26, 2014

Ice Sheet Contribution to Sea-Level Rise


This animation merges 20 years of satellite data to demonstrate how much – and how fast – the ice sheets cover Greenland and Antarctica are melting and their contribution to sea-level rise.

Video credit: Planetary Visions

Saturday, October 5, 2013

Southern Greenland


Clouds blur our view of the snow below in parts of this image acquired over the southern tip of Greenland by the Landsat-8 satellite on 30 May 2013. Long fjords reach far inland and, zooming in on the tips of some of their 'fingers', we can see ice streams that drain the Greenland ice sheet. In the lower part of the image, white dots speckle the North Atlantic Ocean, like stars in the night sky. These are icebergs that – although they appear insignificant in this image – pose a major threat to ships.

This image is featured on the Earth from Space video program.

Photo credit: USGS/ESA

Friday, August 30, 2013

Greenland's Hidden Grand Canyon


Hidden for all of human history, a 460 mile long canyon has been discovered below Greenland's ice sheet. Using radar data from NASA's Operation IceBridge and other airborne campaigns, scientists led by a team from the University of Bristol found the canyon runs from near the center of the island northward to the fjord of the Petermann Glacier.

A large portion of the data was collected by IceBridge from 2009 through 2012. One of the mission's scientific instruments, the Multichannel Coherent Radar Depth Sounder, operated by the Center for the Remote Sensing of Ice Sheets at the University of Kansas, can see through vast layers of ice to measure its thickness and the shape of bedrock below.

Video credit: NASA

Note: For more information, see Mega-Canyon Discovered Beneath Greenland Ice.

Saturday, December 22, 2012

Kangerdlugssuaq Glacier, Greenland


The Kangerdlugssuaq glacier and its ice stream are pictured in this week’s image, acquired on 19 September 2012 by Landsat-7. It is the largest outlet glacier on Greenland’s east coast, discharging ice into the surrounding oceans. In this image we can see hundreds of icebergs speckling the water. A recent study based on satellite observations revealed that over the past 20 years the ice melting in Greenland and Antarctica has contributed about 11 mm to the global sea-level rise. This image clearly shows the glacier’s calving front, where ice breaks away. Over the years, satellite images have shown that this front has retreated – an indication that the glacier is getting smaller over time.

This image is featured on the Earth from Space video program.

Photo credit: USGS/ESA

Sunday, July 22, 2012

Petermann Glacier


The Petermann Glacier grinds and slides toward the sea along the northwestern coast of Greenland, terminating in a giant floating ice tongue. Like other glaciers that end in the ocean, Petermann periodically calves icebergs. A massive iceberg, or ice island, broke off of the Petermann Glacier in 2010. Now, nearly two years later, another chunk of ice has broken free.

The Moderate Resolution Imaging Spectroradiometer, or MODIS, on NASA’s Aqua satellite observed the new iceberg calving and drifting downstream on July 16–17, 2012. Because Aqua is a polar-orbiting satellite, it makes multiple passes over the polar regions each day.

Photo credit: NASA

Monday, April 16, 2012

Greenland Coast


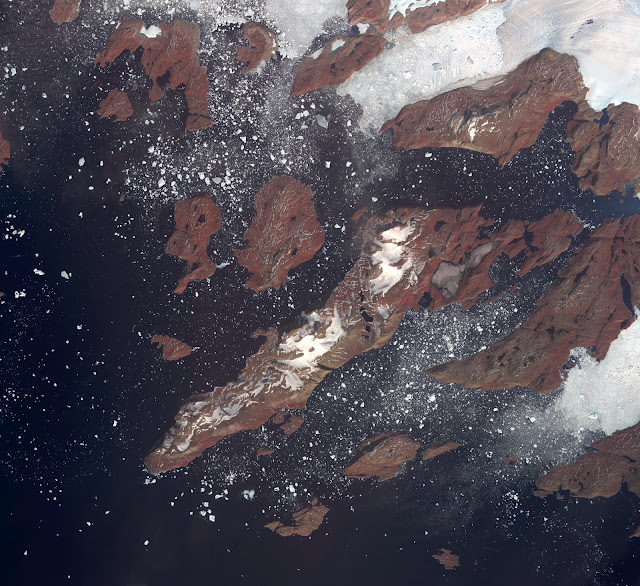
The west coast of Greenland is one of Earth's premiere incubators for icebergs, large blocks of land ice that break off from glaciers or ice shelves and float in the ocean, where they are transported by winds and currents and can pose potential threats to shipping. The Advanced Spaceborne Thermal Emission and Reflection Radiometer (ASTER) instrument on NASA's Terra spacecraft captured this image of icebergs off the west coast of Greenland, on July 17, 2005. The largest iceberg in the image, seen in the top center of the image coming off of a glacier, is about 4,128 feet (1,270 meters) in length. The image covers an area of 26.8 by 29.3 miles (43.2 by 47.2 kilometers), and is located at 74.6 degrees north latitude, 56.7 degrees west longitude. The reddish color on land is vegetation.

Photo credit: NASA/GSFC/METI/ERSDAC/JAROS, and U.S./Japan ASTER Science Team