Showing posts with label Pacific Ocean. Show all posts

Monday, January 20, 2014

Colby Fire Anaglyph


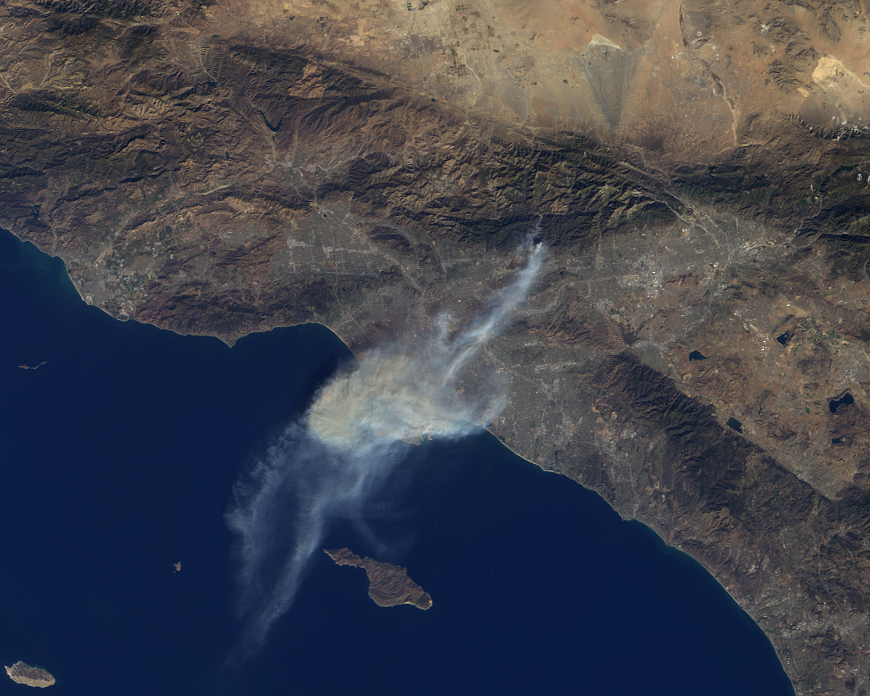
On January 16, 2014, dry conditions and warm winter temperatures in California permitted embers from a campfire in the hills above Glendora, California, to grow into a large wildfire that claimed several homes, caused mandatory evacuations of about 2,000 people, and sent smoke and ash across the Los Angeles Basin, prompting an air quality alert by public health officials. The Multi-angle Imaging SpectroRadiometer (MISR) instrument aboard NASA's Terra spacecraft passed over the region at 10:45 a.m. on January 16, about five hours after the fire was first reported.

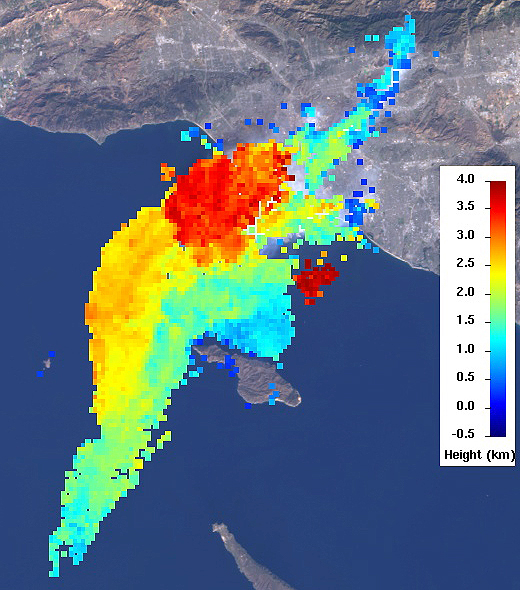
This set of images of the Colby Fire shows a natural color rendering (Figure 1) from MISR's vertical-viewing (nadir) camera. Winds carried the smoke out over the Pacific Ocean to at least 118 miles (190 kilometers) from the inland fire location. Combining the MISR nadir image with a view acquired at 46 degrees off of nadir, a stereoscopic "anaglyph" image is generated, giving a 3-D view of the plume when viewed with red/blue glasses (red filter over the left eye). To give the stereoscopic effect, this image is rotated so that North is at the left. A computer-processed height field is shown in Figure 2, indicating that smoke was elevated to a height of about 2.5 miles (4 kilometers), contributing to the widespread dispersal of the airborne particulates. The results of this analysis also place the areal coverage of the smoke and ash at about 3,860 square miles (10,000 square kilometers).

These data were collected on orbit 74901 of the Terra spacecraft (path 41, MISR blocks 63-64).

Image credit: NASA/GSFC/LaRC/JPL, MISR Team

Note: For more information, see PIA17923: NASA's Terra Spacecraft Images Destructive Colby Fire East of Los Angeles.

Friday, November 29, 2013

San Francisco Bay


An urban sprawl engulfs San Francisco Bay in a sea of lights. The three bridges Oakland Bay Bridge, San Mateo Bridge and Dumbarton Bridge light up as straight lines connecting the coasts. From top right going clockwise freeways pass through Oakland, Hayward, Fremont, San Jose, Palo Alto, Redwood City, San Mateo and San Francisco.

The bright lights of the cities are themselves surrounded by natural parks. Passed the coastal Eastern Bay Regional Parks to the right, the cities of Pleasanton and Walnut Creek keep the dark wilderness at bay with their street lighting. To the left, aside from the Half Moon Bay Airport on the coast, blackness prevails: the Pacific Ocean.

This image was taken on 23 December 2012 by an astronaut on the International Space Station. Circling Earth at an altitude of around 400 km astronauts witness the beauty of our planet from a unique vantage point. At night, human settlements can be seen as street lighting illuminates the sky. ESA developed an automatic camera tripod that compensates for the speed of the Space Station flying at 28 800 km/h to take sharper pictures at night.

Photo credit: ESA/NASA

Tuesday, October 22, 2013

Earth, by Juno


On October 9, NASA's Juno spacecraft flew past Earth, using our home planet's gravity to get the final boost it needed to reach Jupiter. The JunoCam instrument captured this monochrome view of Earth, and other instruments were tested to ensure they work as designed during a close planetary encounter.

The Juno spacecraft was launched from NASA's Kennedy Space Center in Florida on August 5, 2011. Juno's rocket, the Atlas 551, was only capable of giving Juno enough energy or speed to reach the asteroid belt, at which point the Sun's gravity pulled Juno back toward the inner solar system. The Earth flyby gravity assist put Juno on course for arrival at Jupiter on July 4, 2016.

Photo credit: NASA/JPL-Caltech/Malin Space Science Systems

Note: For more information, see PIA17516: Juno's Earth Flyby (Artist's Rendering).

Sunday, June 17, 2012

NASA's Aquarius Maps Ocean Salinity Structure


New research using salinity data from NASA's Aquarius instrument on the Aquarius/SAC-D observatory has given scientists an unprecedented look at a key factor involved in the formation of an oceanic wave feature in the tropical Pacific and Atlantic Oceans that influences global climate patterns.

Tropical instability waves are westward-traveling waves that form along the interface between areas of cold and warm sea surface temperatures near the equator. Existing studies suggest that these waves can have wavelengths of 1,000-2,000 kilometers and have an average period between waves of about one month. These waves redistribute various properties of seawater within the ocean, including temperature, salinity, nutrients, and carbon. They interact with ocean currents, affect large-scale climate patterns such as El Niño and La Niña, and influence marine ecosystems and the carbon cycle.

Previous observations of tropical instability waves have been limited to satellite observations of sea surface temperature, sea level, ocean surface wind, and ocean surface chlorophyll abundance, as well as sparse direct ocean measurements. Salinity has been found to play an important role in the physics of these waves, and observations of their salinity are important to understanding them and their impacts on climate variability and prediction, and biogeochemistry. However, until now salinity observations of them have been limited to very sparse direct ocean measurements. Aquarius provides an unprecedented opportunity to observe their salinity.

In a study in press in the journal Geophysical Research Letters, a team led by Tong Lee of NASA's Jet Propulsion Laboratory, Pasadena, California, and including scientists from Earth & Space Research in Seattle, Aquarius data were used to reveal the salinity structure associated with tropical instability waves in the Pacific Ocean. The figure shows sea surface salinity (color shading in panels a and b) on December 18, 2011, derived from Aquarius measurements, showing the peaks and valleys of tropical instability waves in the eastern to central equatorial Pacific Ocean. The salinity structure is coherent with those obtained from other satellite derived products such as sea surface temperature (contour lines in panel a) and ocean surface currents (arrows in panel b). The unit for the sea surface salinity (SSS) is parts per thousand (the Practical Salinity Unit or PSU). The unit for sea surface temperature (SST) is degree centigrade.

The team found that Aquarius' salinity observations showed a clear signature of the waves near the equator in the Pacific Ocean where large contrasts in salinity occur between the saltier waters of the South Pacific and fresher waters of the North Pacific. The Aquarius data reveal that the waves move much faster at the equator than they do away from the equator, a feature that had not previously been well documented.

Aquarius observations show that near the equator, the waves have a dominant period of approximately 17 days. Aquarius' ability to reveal oceanic features on such short timescales was unexpected, as the mission was designed to study salinity changes on time scales of a month and longer. Salinity variability associated with tropical instability waves is larger near the equator, while sea surface temperature and sea level variability associated with the waves is larger a few degrees away from the equator. Salinity observations from Aquarius can therefore fill an important gap in studying tropical instability waves by providing measurements that are complementary to other satellite observations and direct ocean measurements.

Reference: Lee, T.; G. Lagerloef; M. Gierach; H.-Y. Kao; S. Yueh; and K. Dohan, 2012: "Aquarius reveals salinity structure of tropical instability waves," Geophysical Research Letters, in press.

Image credit: NASA/JPL-Caltech/GSFC

Saturday, April 14, 2012

Perpetual Ocean


Driven by wind and other forces, currents on the ocean surface cover our planet. Some span hundreds to thousands of miles across vast ocean basins in well-defined flows. Others are confined to particular regions and form slow-moving, circular pools. Seen from space, the circulating waters offer a study in both chaos and order. The visualization below, based on ocean temperature, salinity, sea surface height and sea ice data collected during field observations and by NASA satellites between July 2005 and December 2007, highlights many of the world's most important ocean surface currents. Watch powerful, fast-moving currents like the Gulf Stream in the Atlantic Ocean and the Kuroshio in the Pacific Ocean carry warm waters northeastward at speeds greater than 4 mph. View coastal currents such as the Agulhas in the Southern Hemisphere transporting equatorial waters from the Indian Ocean farther southwards. Explore the image collection to compare the direction and unique flow pattern of each of these major currents.

Video credit: NASA/Goddard Space Flight Center

Thursday, April 12, 2012

Flooding in Fiji


Fiji was hard hit by heavy rains in early 2012, causing flooding and landslides. Hardest hit was the western part of the main island of Viti Levu, Fiji, and the principal city of Nadi. Thousands of people were displaced and the Disaster Management Office declared a state of emergency. In this simulated natural color image acquired by the Advanced Spaceborne Thermal Emission and Reflection Radiometer (ASTER) instrument on NASA's Terra spacecraft on April 7, 2012, the muddy overflowing Nadi River and its tributaries are seen winding through the city of Nadi. The image covers an area of 10.7 by 12.5 miles (17.3 by 20.1 kilometers), and is located at 17.6 degrees south latitude, 177.7 degrees east longitude.

Photo credit: NASA/GSFC/METI/ERSDAC/JAROS, and U.S./Japan ASTER Science Team

Sunday, March 25, 2012

Indonesian Islands


This image from the Envisat satellite is dominated by the Indonesian islands of Bali, Lombok and Sumbawa. Bali's central mountains include peaks that reach over 3000 m, including an active volcano visible on the right side of the island. Strong reflections of the radar signal used to produce this image appear like specks of light. They are mainly detectable in the southern part of the island, and are particularly concentrated around the provincial capital city of Denpasar. This is the typical appearance of built-up areas in radar images, owing to the multiple reflection of the radar beam by buildings and especially metal constructions.

This image is a compilation of three passes by Envisat’s radar on 20 June, 19 August and 17 December 2011. Each is assigned a color (red, green and blue) and combined to produce this representation. The colors reveal changes in the surface between Envisat’s passes.

Photo credit: ESA

Monday, February 13, 2012

Blue Marble 2012


A 'Blue Marble' image of the Earth taken from the VIIRS instrument aboard NASA's most recently launched Earth-observing satellite - Suomi NPP. This composite image uses a number of swaths of the Earth's surface taken on January 4, 2012. The NPP satellite was renamed 'Suomi NPP' on January 24, 2012 to honor the late Verner E. Suomi of the University of Wisconsin.

Suomi NPP is NASA's next Earth-observing research satellite. It is the first of a new generation of satellites that will observe many facets of our changing Earth.

Suomi NPP is carrying five instruments on board. The biggest and most important instrument is The Visible/Infrared Imager Radiometer Suite or VIIRS.

Photo credit: NASA/NOAA/GSFC/Suomi NPP/VIIRS/Norman Kuring