Saturday, March 8, 2014

Margarita Island, Venezuela


Situated in the southern Caribbean Sea about 20 km off of mainland Venezuela’s coast, the island comprises two peninsulas linked by a long, narrow strip of land – called an isthmus.

The eastern part of the island is home to most of the island’s residents, while the Macanao peninsula to the west is dominated by a central mountain range.

Between the peninsulas and cut off from the open sea by the isthmus lies the La Restinga lagoon, a national park that appears as a dark green and blue area in this image.

Recognized as a wetland of international importance by the Ramsar Convention, the area features picturesque mangroves and is an important feeding ground for birds such as herons and flamingos. The shallow waters are home to red snappers, sardines and swordfish – among other types of fish – and oysters grow on the mangrove roots.

Japan's ALOS satellite captured this image on 26 June 2010 with its AVNIR-2 Advanced Visible and Near Infrared Radiometer.

ALOS was supported as a Third Party Mission, which means that ESA used its multi-mission ground systems to acquire, process, distribute and archive data from the satellite to its user community.

In April 2011 the satellite abruptly lost power while mapping Japan’s tsunami-hit coastline.

This image is featured on the Earth from Space video program.

Image credit: JAXA/ESA

Friday, March 7, 2014

The Iberian Peninsula


This image from the International Space Station shows the Iberian Peninsula including Spain and Portugal at night.

The lights from human settlements reveal where the major towns and activity are. The large mass of light in the middle is Madrid, Spain’s capital city. The Iberian coastline is heavily populated with Valencia and Barcelona along the Mediterranean Sea prominent at the bottom right of this photo.

Portugal to the west shows similar lighting with the coast from Lisboa to Porto a haze of light.

This astronaut-image taken from 400 km above Earth shows how close the Iberian Peninsula is to Morocco. A thin line of blackness – the Strait of Gibraltar – separates the two.

Another thin line stands out in this picture – Earth’s atmosphere, the green shroud that surrounds and protects our world and the people and animals that live on it.

Photo credit: ESA/NASA

Thursday, March 6, 2014

Arctic Ocean Ice Melt From Warm Mackenzie River Flows


These images show sea surface temperatures of the Beaufort Sea where Canada's Mackenzie River discharges into the Arctic Ocean, as measured by the Moderate Resolution Imaging Spectroradiometer (MODIS) instrument on NASA's Terra spacecraft. The image at left was obtained June 14, 2012, before discharged waters from the Mackenzie River (located in the bottom center of the image) broke through the adjacent sea ice barrier (shown in light blue) stuck along the shore of the Mackenzie River delta. The image at right, acquired July 5, 2012, shows the extensive intrusion of heat carried by the river waters once they breached the sea ice barrier (shown in yellow, orange and red). Scientists saw an increase of 11.7 degrees Fahrenheit (6.5 degrees Celsius) in the surface temperature of the open water, which enhanced sea ice melt.

Image credit: NASA

Note: For more information, see PIA18035: Warm Rivers Play Role in Arctic Sea Ice Melt (Animation) and NASA: Warm Rivers Play Role in Arctic Sea Ice Melt.

Wednesday, March 5, 2014

Vatican City


The Vatican City State is a sovereign city-state, whose area is a 44 hectare walled enclave west of the Tiber River, within the city of Rome. With a population of about 850, it is the smallest independent state in the world by both area and population. The independent city-state was established in 1929 by King Victor Emanuelle III of Italy. Vatican City is an ecclesiastical state ruled by the Bishop of Rome -- the Pope. The image was acquired July 4, 2010, covers an area of 10 by 13 km, and is located at 41.9 north, 12.5 east.

Image credit: NASA/GSFC/METI/ERSDAC/JAROS, and U.S./Japan ASTER Science Team

Saturday, March 1, 2014

Cotopaxi and Antisana Volcanos


Ecuador’s northern highlands are pictured in this image from Envisat.

Near the top left of the image, the southern outskirts of Ecuador’s capital, Quito, appear as white dots. Quito is one of the highest capital cities in the world, at an elevation of 2850 m above sea level.

This area is part of the northern zone of the Andean Volcanic Belt. The belt was formed as a result of the Nazca and Antarctic tectonic plates moving under the South American plate – a geological process called ‘subduction’.

Near the bottom-left corner is the Cotopaxi stratovolcano. It is the second highest summit in the country at about 5900 m and one of Ecuador’s most active volcanoes, erupting more than 50 times since the early 1700s.

On the center-right side of the image is the Antisana volcano.

What look like white glaciers at the peaks of these mountains are actually artifacts of the radar echo – the surfaces of the summits are more or less directly facing the satellite, so the radar signal reflects straight back to the antenna.

This image was created by combining three Envisat radar passes from 4 June 2006, 20 January 2008 and 24 January 2010 over the same area.

Colors represent changes in the land’s surface between the three radar scans that make up this composite image. Some of the changes are distinct, such as the patchwork showing changes in agricultural plots near the top left. From Antisana to the west, the area is generally colorful, indicating ground movement.

East of Antisana, however, the area is less colorful, and therefore more stable.

This image is featured on the Earth from Space video program.

Image credit: ESA

Friday, February 28, 2014

Lodz, Poland


In the center of Poland lies its third-largest city: Łódź. Seen from the International Space Station at night the city’s lights contrast with the blackness of the surrounding countryside.

Unlike many pictures of night-time Earth, the local airport is not the most striking visual marker. The Łódź Władysław Reymont Airport seems to be obscured by clouds causing the slight blurring seen to the bottom left of Łódź.

In this picture land-transport is responsible for the distinctive ‘X’ at the top right: a motorway junction near the town of Stryków. The lights to the left of the junction correspond to a transport hub for trucks.

Satellite towns of Pabianice (bottom-left) and Zgierz (top) also show up clearly in this picture.

This image was taken by an astronaut from 400 km above Earth in April 2012.

Photo credit: ESA/NASA

Thursday, February 27, 2014

Flooding in Bolivia


Extremely heavy seasonal rains have fallen on northern Bolivia since October 2013. Resulting floods have affected as many as 150,000 inhabitants, and threatened around 100,000 head of cattle. The worst affected province is Beni in the northeastern part of the country. In this image, acquired February 25, 2014, by the Advanced Spaceborne Thermal Emission and Reflection Radiometer (ASTER) instrument on NASA's Terra spacecraft, vegetation is red, clouds are white, and flooded areas are grey-brown. The image covers an area of 21 by 22 miles (34 by 35 kilometers) and is located near 14 degrees south, 66.5 degrees west.

Image credit: NASA/GSFC/METI/ERSDAC/JAROS, and U.S./Japan ASTER Science Team

Tuesday, February 25, 2014

Rapid Mapping of European Floods


Floods across central Europe caused widespread damage in 2013. Maps based on satellite data can help emergency services plan their response to such events. Through the Copernicus Emergency Management Service, 118 maps were produced to assist in flood relief.

Video credit: ESA/DLR

Note: For more information, see Flood Mapping Highlight.

Monday, February 24, 2014

Kelud Volcano, Java, Indonesia


The February 13, 2014, violent eruption of Kelud stratovolcano in Java, Indonesia sent volcanic ash covering an area of 70,000 square miles (181,300 square kilometers), and prompted the evacuation of tens of thousands of people. Earlier 20th century eruptions killed thousands of people, mainly as the result of hot mudflows ("lahars"). This image from the Advanced Spaceborne Thermal Emission and Reflection Radiometer (ASTER) instrument on NASA's Terra spacecraft was acquired on February 20, after the eruption had greatly diminished. Ash-covered areas are seen on the north slopes of the volcano (the summit is hidden underneath clouds); ash-choked rivers flow down the west and southwest flanks of the volcano. ASTER's thermal infrared channels show continued activity at the summit. The image covers an area of 14.2 by 16.1 miles (23 by 26 kilometers), and is located at 7.9 degrees south, 112.3 degrees east.

Photo credit: NASA/GSFC/METI/ERSDAC/JAROS, and U.S./Japan ASTER Science Team

Sunday, February 23, 2014

The Ganges Delta


Proba-V images the Ganges Delta, the world’s largest delta, in the area of Bangladesh and India. The delta plain, about 350 km wide along the Bay of
Bengal, is formed by the confluence of the rivers Ganges, the Brahmaputra and Meghna. This Proba-V Vegetation image was acquired on 2 February 2014 at 100 m spatial resolution.

Image credit: ESA/VITO

Saturday, February 22, 2014

Kumbunbur Creek, Australia


This false-color satellite image shows the Kumbunbur Creek in Australia’s Northern Territory, about 260 km southwest of the city of Darwin.

The green ‘branches’ of what looks like a tree are the waterways of runoff that flow into the Timor Sea (not pictured).

The false-color makes vegetation appear bright red, and we can clearly see how vegetation grows mainly along the waterways. Vegetation is more evenly dispersed across the plain to the north.

The image was captured by the Kompsat-2 satellite on 20 September 2011, near the end of the dry season. The dry areas with a somewhat dull color in this image become flooded mudflats during the rainy season.

The rainy season occurs during a tropical area’s summer months because of increased heat from the Sun’s more direct impact angle. Higher temperatures lead to an increase in evaporation and rising, warm air masses. This air expands and cools, leading to the formation of cumulus clouds, and almost daily rainfall and thunderstorms.

As seasons change, the location of these rainfalls travels to areas with the highest Sun impact angles, resulting in wet and dry seasons in different zones of the tropics.

The tropics are the region of Earth north and south of the equator. Some areas of northern Australia are part of the tropical climate zone.

This image is featured on the Earth from Space video program.

Image credit: KARI/ESA

Friday, February 21, 2014

Milan, Italy


This patchwork of light is Milan, Italy, seen from space at night. An astronaut on the International Space Station took this picture from 400 km above Earth traveling at speeds of 28,800 km/h.

Street-lighting and well-lit buildings stand out from the darkness of agricultural fields and show the urban sprawl of this North-Italian city.

Two features stick out. The rectangular outline at the top left of the city center is Fiera Milano, a trade and exhibition fair that was holding an event at the time this picture was taken, 8 December 2012.

At the top left is the City of Milan Airport clearly showing its runways for approaching aircraft.

This image was taken with the Nightpod camera-stand that tracks the movement of Earth passing under the International Space Station keeping any target fixed in the middle of the viewfinder. Standard cameras fixed to Nightpod can take pictures with longer exposure times so astronauts can take sharper pictures of cities at night.

Photo credit: ESA/NASA

Thursday, February 20, 2014

Flooding on the Thames River


On February 17, 2014, the United Kingdom Environment Agency had issued flood warnings for the area from Walton-on-Thames in the east to Reading in the west, as depicted in this image acquired by the Advanced Spaceborne Thermal Emission and Reflection Radiometer (ASTER) instrument on NASA's Terra spacecraft on February 16, 2014. High water levels and flooding along the Thames River west of London were part of a larger picture of devastation throughout southwest England and Wales, as record-breaking rains covered the United Kingdom in January and February. In this image, vegetation is red; clouds are white and their shadows are black; the Thames River flows across the image in dark cyan color. The image covers an area of 17.7 by 28.5 miles (28.5 by 46 kilometers), and is located near 51.5 degrees north, 0.7 degrees west.

Image credit: NASA/GSFC/METI/ERSDAC/JAROS, and U.S./Japan ASTER Science Team

Wednesday, February 19, 2014

Río de la Plata


Río de la Plata estuary between Argentina and Uruguay, acquired by Proba-V in November 2013.

Image credit: ESA/BELSPO

Tuesday, February 18, 2014

Lagoa dos Patos, Brazil


Proba-V demonstrates its maximum resolution in this view of part of the Lagoa dos Patos lagoon, in the state of Rio Grande do Sul, southern Brazil. The city of Porto Alegre is located at the top of the image, visible as a greyish tint. This highlight from a Proba-V Vegetation image was acquired on 6 February 2014 from the central portion of the instrument swath at 100 m resolution.

Image credit: ESA/VITO

Saturday, February 15, 2014

Miscanti and Miñiques Lakes


This satellite image shows the heart-shaped Miscanti lake and smaller Miñiques lake in northern Chile.

The lakewater is brackish – meaning that it’s saltier than freshwater, but not as much as seawater. This is due to the salinity in the soil. Chile’s largest salt flat – the Salar de Atacama – lies to the west (not pictured).

Two partially snow-covered volcanoes can be seen above and below the lakes on the right, while plains stretch out to the west in a nearly vegetation-free environment.

The area pictured is part of the Atacama Desert, which runs along part of South America’s central west coast. It is considered one of the driest places on Earth, as moisture from the Amazon Basin is blocked by the Andes to the east, as well as from the Pacific Ocean by the Chilean Coastal Range to the west. Pacific Ocean currents and wind circulation also play a major role in the desert climate.

Because of the Atacama plateau’s high altitude, low cloud cover and lack of light pollution, it is one of the best places in the world to conduct astronomical observations and home to two major observatories.

Some areas of the desert have been compared to the planet Mars, and have been used as a location for filming scenes set on the red planet. Just last year, ESA tested a self-steering rover in the Atacama, which was selected for its similarities to Martian conditions.

The Japanese Advanced Land Observation Satellite, or ALOS, captured this image on 30 May 2010.

This image is featured on the Earth from Space video program.

Photo credit: JAXA/ESA

Friday, February 14, 2014

Cairo and the Nile River


This night-time image of the Nile River running into the delta that ends in the Mediterranean Sea clearly shows Egypt’s capital city, Cairo, and its satellite cities. The image taken by an astronaut on the International Space Station shows how humans have colonized our planet over the ages.

To the left is 6th of October City that was established in 1979. The modern city reveals itself by the squarer lines compared to the more organic Cairo that evolved over thousands of years of human settlement. The regular block of light above and to the right of 6th of October City is Sheikh Zayed City, established in 1995.

To the right of Cairo are even newer settlements, the aptly named New Cairo City houses many universities and lies in the desert further away from the resource-rich Nile river. These satellite cities attract people away from the densely populated Cairo.

To the North (top-right in this picture) lie the agricultural fields that rely on water from the Nile River. Interspersed at crossroads are smaller cities and villages that give off the distinctive yellow glow of human settlements at night.

Photo credit: ESA/NASA

Thursday, February 13, 2014

Mount Etna


Mount Etna, Europe's most active volcano, continued its latest eruptive activity with a new lava flow from the recently formed southeast crater. In this February 7, 2014 image acquired from the Advanced Spaceborne Thermal Emission and Reflection Radiometer (ASTER) instrument on NASA's Terra spacecraft, vegetation is red, snow is white and bare lava flows are dark gray. The yellow pixels are areas that are highlighted in the thermal infrared channels, and indicate the hot crater (single spot) and the lava flow. To the east, the thin blue-gray cloud is ash and gas emitted from the crater. The image covers an area of 12.4 by 13.7 miles (20 by 22 kilometers), and is centered near 37.5 degrees north, 15 degrees east.

Image credit: NASA/GSFC/METI/ERSDAC/JAROS, and U.S./Japan ASTER Science Team

Note: For more information, see Sicily.

Wednesday, February 12, 2014

Mount Sinabung


Mount Sinabung is a stratovolcano located in Indonesia. In late 2013, a lava dome formed on the summit. In early January 2014, the volcano erupted, and it erupted again in early February. Tall ash columns deposited material over a wide area; pyroclastic flows rumbled down the volcano's slopes, engulfing villages and resulting in fatalities.

On February 10, 2014, the Advanced Spaceborne Thermal Emission and Reflection Radiometer (ASTER) instrument on NASA's Terra spacecraft captured an image of Sinabung: the top image depicts vegetation in red; an ash plume is light gray streaming eastward from the summit; light-colored areas on the southeast flank are pyroclastic and ash deposits. The bottom image is a composite of ASTER thermal infrared bands: the plume is in purple, indicating that its composition is mostly ash; the white triangular area is hotter than the surrounding materials; blue streaks are water clouds. The images cover an area of 10.3 by 19.6 miles (16.5 by 31.5 kilometers), and are centered at 3.2 degrees north, 98.4 degrees east.

Image credit: NASA/GSFC/METI/ERSDAC/JAROS, and U.S./Japan ASTER Science Team

Sunday, February 9, 2014

Sierra Leone Estuary


The Sierra Leone estuary became a focal point for trade and interaction between Africans and Europeans because of its exceptional harbor, starting in the mid-15th century. European ships were unable to land along much of the West African coast due to lack of safe anchorage. By contrast, the Sierra Leone estuary offers ideal anchorage for trading ships. Around 1672, the English established and fortified themselves at Bunce Island. By the mid-eighteenth century, Sierra Leone had become a major trading participant with Europe and the Americas. The image was acquired December 28, 2009, covers an area of 32x45 km, and is located at 8.5 degrees north, 13 degrees west.

Image credit: NASA/GSFC/METI/ERSDAC/JAROS, and U.S./Japan ASTER Science Team

Saturday, February 8, 2014

Jeddah, Saudi Arabia


The city of Jeddah’s seaport on Saudi Arabia’s western coast is pictured in this image from the Kompsat-2 satellite.

The second largest city in the country, Jeddah has a population of over five million people. The city is a gateway to Islam’s holiest city of Mecca, which lies about 60 km to the east, as well to the holy city of Medina, about 320 km north.

It is also an important commercial hub, with its port located in the middle of an important shipping route between east and west. Zooming in, we can see some large container vessels in the port.

Near the bottom of the image, the large circles are the tanks of an oil refinery. The oil industry comprises about 45% of Saudi Arabia’s gross domestic product, and 90% of export earnings. Saudi Arabia is the world’s number-one oil exporter, and therefore plays a major role in the global energy industry. Its policies on the production and export of oil, natural gas and petroleum products have a major impact on the energy market, as well as the global economy.

The Red Sea’s coral reefs are visible off the coast. In fact, this is one of the few places along this coastline with a gap in the reef, enabling large vessels to approach the coast.

This image, also featured in the Earth from Space video program, was acquired on 17 March 2013 by the Korea Aerospace Research Institute’s Kompsat-2 satellite.

Photo credit: KARI/ESA

Friday, February 7, 2014

Osaka, Japan


Osaka lies to the West of Tokyo and is Japan’s third-largest city. The city runs along the Yodo river and stretches along the coast of Osaka Bay.

Images of our planet at night taken from the International Space Station show that people have settled where the living is easy – along rivers and bays. Artificial lights from human habitation and industry highlight the advantages of settling next to rivers and seas where water provides food, waste disposal, transport and cooling for factories.

The white lights in the center of this picture correspond to Osaka’s two city centers, Kita and Minami, where businesses, shopping streets and areas of entertainment are concentrated.

To the Northeast, across the river Yodo, lies Itami Airport, the yellow vertical lights to the right of a river running North-South. The airport shares the load of landing aircraft in the Osaka area with Kobe and Kansai airports that were both built on artificial islands in Osaka Bay. The yellow lights of Kobe airport can be seen at the top-left of Osaka Bay in this picture, Kansai airport is just outside the frame.

Photo credit: ESA/NASA


Thursday, February 6, 2014

Sochi, Russia


The Black Sea resort of Sochi, Russia, is the warmest city ever to host the Winter Olympic Games, which open on February 7, 2014, and run through February 23. This north-looking image, acquired on January 4, 2014, by the Advanced Spaceborne Thermal Emission and Reflection Radiometer (ASTER) instrument on NASA's Terra spacecraft, shows the Sochi Olympic Park Coastal Cluster -- the circular area on the shoreline in the bottom center of the image -- which was built for Olympic indoor sports. Even curling has its own arena alongside multiple arenas for hockey and skating. The Olympic alpine events will take place at the Mountain Cluster, located in a snow-capped valley at the top right of the image. Sochi itself, a city of about 400,000, is not visible in the picture. It's farther west (left) along the coast, past the airport at bottom left.

In the image, red indicates vegetation, white is snow, buildings are gray and the ocean is dark blue. The area imaged is about 15 miles (24 kilometers) from west to east (left to right) at the coastline and 25 miles (41 kilometers) from front to back. Height is exaggerated 1.5 times. The image was created from the ASTER visible and near-infrared bands, draped over ASTER-derived digital elevation data.


The 2014 Winter Olympic ski runs may be rated double black diamond, but they're not quite as steep as they appear in this image of the skiing and snowboarding sites for the Sochi Winter Olympic Games, acquired on January 4, 2014, by the Advanced Spaceborne Thermal Emission and Reflection Radiometer (ASTER) instrument on NASA's Terra spacecraft. Rosa Khutar ski resort near Sochi, Russia, is in the valley at center, and the runs are visible on the shadowed slopes on the left-hand side of the valley. Height has been exaggerated 1.5 times to bring out topographic details. The games, which begin on February 7 and continue for 17 days, feature six new skiing and boarding events plus the return of the legendary Jamaican bobsled team to the Winter Games for the first time since 2002.

In this southwest-looking image, red indicates vegetation, white is snow, and the resort site appears in gray. The area imaged is about 11 miles (18 kilometers) across in the foreground and 20 miles (32 kilometers) from front to back. The image was created from the ASTER visible and near-infrared bands, draped over ASTER-derived digital elevation data.

Image credits: NASA/GSFC/METI/ERSDAC/JAROS, and U.S./Japan ASTER Science Team (top and bottom)

Note: For more information, see NASA Satellite Eyes Sochi Olympic Sites. Also, Proba-V’s Olympic View.

Tuesday, February 4, 2014

Monitoring Alaskan Lake Ice


In northern Alaska, within the Arctic circle, the ice regimes of shallow lakes were documented using 79 radar images from the ERS-1 and -2 satellites. How the radar signals bounced back to the sensor indicated ‘floating ice’ versus ‘grounded ice’ (fully frozen lake) when radar energy was absorbed into the ground. The data showed that from 1992 to 2011 the lakes in this region experienced a 22% reduction in grounded ice – the equivalent of ice thinning by 21–38 cm.

Video credit: Planetary Visions / University of Waterloo, Canada / ESA

Saturday, February 1, 2014

Zambezi River, Zambia


This image from Envisat’s radar shows the Zambezi River’s floodplain in western Zambia.

The city of Mongu appears as a cluster of white radar reflections on the right side of the image. It is about 15 km from the river’s main channel – which appears light green, snaking down the left side of the image – but during the wet season, the waters rise right up to the edge of the town.

This image is a compilation of three acquisitions from Envisat’s radar. Each acquisition is assigned a color, and when combined show changes between the acquisitions.

The individual images were acquired on 1 March, during the wet season, 27 September and 26 December, when water levels were low, all during 2011. Combined, the psychedelic array of colors reveal how drastically the floodplain changes between seasons.

As the second largest wetland in Zambia, the Zambezi floodplain is a major spawning ground for fish. With about 80 different fish species, it serves as a source of livelihood to the local people, along with harvesting of other wetland resources like reeds and sedges for handicraft, and rice cultivation.

But this area is threatened by unsustainable fishing, animal poaching and the dredging of canals.

The Zambezi floodplains is just one of the over 2000 sites worldwide considered to be wetlands of international importance by the Ramsar Convention – an intergovernmental treaty for the sustainable use of wetlands. World Wetlands Day is observed on 2 February, the anniversary of the signing of the Convention.

ESA assists the Ramsar Convention through the GlobWetland project and the TIGER initiative ‘Looking After Water in Africa’, which provide satellite data to be used to monitor these precious resources.

This image is featured in the Earth from Space video program.

Image credit: ESA

Friday, January 31, 2014

Tianjin, China


Tianjin, China, lies around 100 km southeast of Beijing near China’s eastern coast. At the top right of this image – taken from the International Space Station at night – is the Tianjin Port welcoming ships from the Bohai Bay.

The street lighting in Tianjin is interesting as it shows two different colors, presumably from different lighting technologies. At night the dual urban areas of Tianjin show up clearly with the center and old city in the middle and the newer urban city of Binhai to the right along with the port.

The other two lit-up areas in this image are the cities of Wuqing on the road to Beijing heading North (to the left here) and Jinnan below Binhai.

Tianjin is the fourth largest city of China with over 12 million inhabitants. This image was taken by an astronaut from the International Space Station using Nightpod: ESA’s camera aid that tracks the motion of Earth as our planet flies underneath the orbital outpost at 28,800 km/h. The resulting images are sharper than if an astronaut compensates for the Earth’s rotation by hand.

Photo credit: ESA/NASA

Wednesday, January 29, 2014

Hofsjökull Ice Cap, Iceland


This image shows a small part of the Hofsjökull ice cap in Iceland, which encompasses several glaciers. The fan at upper left is part of a glacier called Mûlajökul.


The above map shows the flight path (red lines) for a single flight to map flow speeds across two ice caps with the UAVSAR instrument. Each five-hour flight will follow this same complicated path for optimal coverage. The ice caps appear in white in the center of the tangled flight lines; Langjökull is west (left) of Hofsjökull. Keflavik International Airport is on the peninsula in the southwest.

A high-precision radar instrument from NASA's Jet Propulsion Laboratory, Pasadena, California, left Southern California for Iceland today to create detailed maps of how glaciers move in the dead of winter. This will help scientists better understand some of the most basic processes involved in melting glaciers, which are major contributors to rising sea levels.

Photo and map credit: Caltech

Note: For more information, see NASA Radar Maps the Winter Pace of Iceland's Glaciers.

Saturday, January 25, 2014

Kilimanjaro, Tanzania


This false-color image from Japan’s ALOS satellite was acquired over part of southern Kenya and the border with Tanzania.

Mount Kilimanjaro in Tanzania can be seen in the lower-left corner. At 5895 m above sea level, this dormant volcano is Africa’s highest mountain.

Kilimanjaro is a critical water catchment area for both Kenya and Tanzania, but over the past century more than 80% of its ice cover – which acts as a water storage – has disappeared. The receding ice cap together with deforestation have caused several rivers to dry up, affecting forests and farmland below.

In this image, bright red areas show the rich vegetation of the forested area on the slopes of Kilimanjaro, as well as vegetation of the agricultural areas and along rivers and streams.

False color allows for better discrimination between different vegetation types. This is particularly helpful when satellite data are used in agricultural monitoring for mapping and classifying land use, crop type, crop health, change detection, irrigated landscape mapping and crop area mapping.

The upper section of the image is dominated by plains in southern Kenya. Nearby are a number of national parks (not shown) that attract tourists looking to see the wildlife. Animals found in this area include elephants, cape buffalo, lion, giraffe, zebra and wildebeest, among many others.

This image, also featured in the Earth from Space video program, was acquired on 20 March 2009.

Image credit: JAXA/ESA

Friday, January 24, 2014

Rome, Italy


Italy’s capital city shows a distinctive patchwork of lights and darker areas when seen from the International Space Station at night. Unlike England’s capital city, Rome’s A90 ring road, the “Grande Raccordo Anulare”, is not so visible due to different motorway lighting. No single point of interest strikes out from the patchwork of roads, parks and green areas.

Rome was famously founded along the Tiber river, seen here winding its way downwards to the bottom of the image, but even the Tiber river gets lost in the sea of light at the center of Rome. The dark patches are parks, ancient ruins and green areas without street lighting. To the bottom right of this picture is the hilly area and regional park of Decima-Malafede where humans have not settled. Instead Rome has expanded over the years in other directions. At the top of this picture, newer, sub-urban settlements are characterized by the straight streets.

ESA’s center for Earth Observation at the ESRIN facility near Frascati can be seen to the right of this picture, above the blackness of Albano lake.

Clouds covered parts of Rome and caused the blurry areas at the bottom half of this picture taken 12 December 2013 by an Expedition 38 astronaut.

Image credit: ESA/NASA

Thursday, January 23, 2014

Bahrain


The Kingdom of Bahrain is a small island country near the western shore of the Persian Gulf. In 1971 Bahrain declared independence from its previous status as a United Kingdom protectorate. At that time the population was about 200,000. By 1985, the population had grown to 425,000; and in 2010, the population was over 1,200,000. The rapid development of the country is dramatically seen in the northern half of the country from these three satellite images: acquired in 1972 (Landsat Multispectral Scanner), 1987 (Landsat Thematic Mapper) and 2011 (ASTER). The images cover an area of 30 x 30 km, and are located at 26.2 degrees north, 50.5 degrees east.

Image credit: NASA/GSFC/METI/ERSDAC/JAROS, and U.S./Japan ASTER Science Team

Wednesday, January 22, 2014

Long-Term Climate Warming Trend Sunstained in 2013


NASA scientists say 2013 tied with 2009 and 2006 for the seventh warmest year since 1880, continuing a long-term trend of rising global temperatures. With the exception of 1998, the 10 warmest years in the 134-year record all have occurred since 2000, with 2010 and 2005 ranking as the warmest years on record.

NASA's Goddard Institute for Space Studies (GISS) in New York, which analyzes global surface temperatures on an ongoing basis, released an updated report Tuesday on temperatures around the globe in 2013. The comparison shows how Earth continues to experience temperatures warmer than those measured several decades ago.

"Long-term trends in surface temperatures are unusual and 2013 adds to the evidence for ongoing climate change," GISS climatologist Gavin Schmidt said. "While one year or one season can be affected by random weather events, this analysis shows the necessity for continued, long-term monitoring."

The average temperature in 2013 was 58.3 degrees Fahrenheit (14.6 Celsius), which is 1.1 F (0.6 C) warmer than the mid-20th century baseline. The average global temperature has risen about 1.4 degrees F (0.8 C) since 1880, according to the new analysis. Exact rankings for individual years are sensitive to data inputs and analysis methods.

Scientists emphasize that weather patterns always will cause fluctuations in average temperatures from year to year, but the continued increases in greenhouse gas levels in Earth's atmosphere are driving a long-term rise in global temperatures. Each successive year will not necessarily be warmer than the year before, but with the current level of greenhouse gas emissions, scientists expect each successive decade to be warmer than the previous.

Carbon dioxide is a greenhouse gas that traps heat and plays a major role in controlling changes to Earth's climate. It occurs naturally and also is emitted by the burning of fossil fuels for energy. Driven by increasing man-made emissions, the level of carbon dioxide in Earth's atmosphere presently is higher than at any time in the last 800,000 years.

The carbon dioxide level in the atmosphere was about 285 parts per million in 1880, the first year in the GISS temperature record. By 1960, the atmospheric carbon dioxide concentration, measured at the National Oceanic and Atmospheric Administration's (NOAA) Mauna Loa Observatory in Hawaii, was about 315 parts per million. This measurement peaked last year at more than 400 parts per million.

While the world experienced relatively warm temperatures in 2013, the continental United States experienced the 42nd warmest year on record, according to GISS analysis. For some other countries, such as Australia, 2013 was the hottest year on record.

The temperature analysis produced at GISS is compiled from weather data from more than 1,000 meteorological stations around the world, satellite observations of sea-surface temperature, and Antarctic research station measurements, taking into account station history and urban heat island effects. Software is used to calculate the difference between surface temperature in a given month and the average temperature for the same place from 1951 to 1980. This three-decade period functions as a baseline for the analysis. It has been 38 years since the recording of a year of cooler than average temperatures.

The GISS temperature record is one of several global temperature analyses, along with those produced by the Met Office Hadley Centre in the United Kingdom and NOAA's National Climatic Data Center in Asheville, North Carolina. These three primary records use slightly different methods, but overall, their trends show close agreement.

Image credit: NASA's Earth Observatory; text credit: NASA

Monday, January 20, 2014

Colby Fire Anaglyph


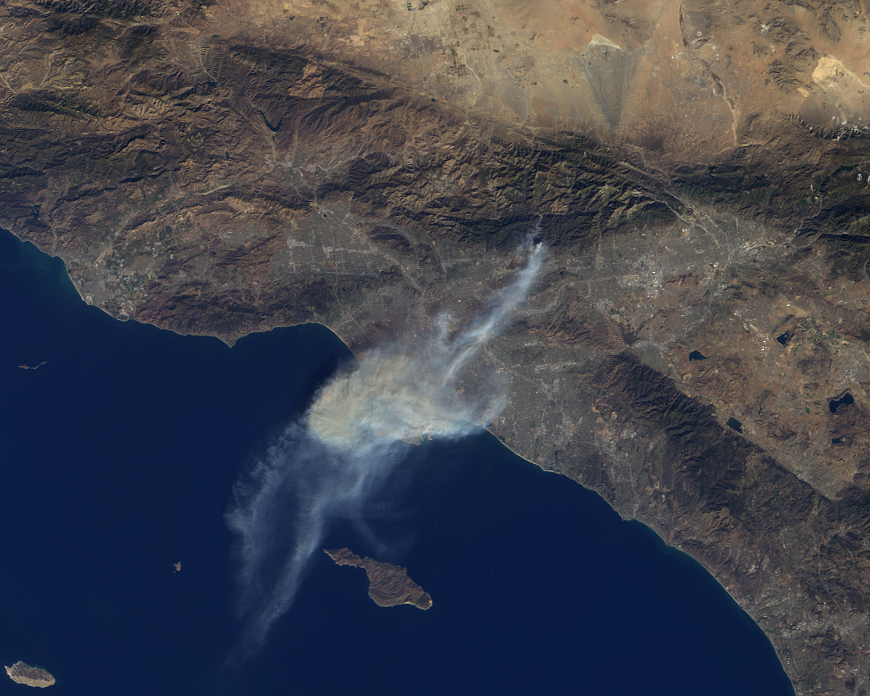
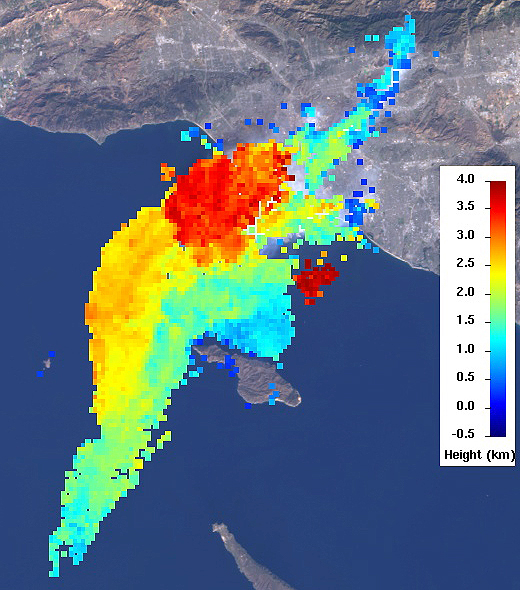
On January 16, 2014, dry conditions and warm winter temperatures in California permitted embers from a campfire in the hills above Glendora, California, to grow into a large wildfire that claimed several homes, caused mandatory evacuations of about 2,000 people, and sent smoke and ash across the Los Angeles Basin, prompting an air quality alert by public health officials. The Multi-angle Imaging SpectroRadiometer (MISR) instrument aboard NASA's Terra spacecraft passed over the region at 10:45 a.m. on January 16, about five hours after the fire was first reported.

This set of images of the Colby Fire shows a natural color rendering (Figure 1) from MISR's vertical-viewing (nadir) camera. Winds carried the smoke out over the Pacific Ocean to at least 118 miles (190 kilometers) from the inland fire location. Combining the MISR nadir image with a view acquired at 46 degrees off of nadir, a stereoscopic "anaglyph" image is generated, giving a 3-D view of the plume when viewed with red/blue glasses (red filter over the left eye). To give the stereoscopic effect, this image is rotated so that North is at the left. A computer-processed height field is shown in Figure 2, indicating that smoke was elevated to a height of about 2.5 miles (4 kilometers), contributing to the widespread dispersal of the airborne particulates. The results of this analysis also place the areal coverage of the smoke and ash at about 3,860 square miles (10,000 square kilometers).

These data were collected on orbit 74901 of the Terra spacecraft (path 41, MISR blocks 63-64).

Image credit: NASA/GSFC/LaRC/JPL, MISR Team

Note: For more information, see PIA17923: NASA's Terra Spacecraft Images Destructive Colby Fire East of Los Angeles.

Sunday, January 19, 2014

Kolkata, India


Lying along the Hooghly river, Calcutta has over 4 million inhabitants. The Hooghly river shows as a black winding line in this picture that was taken from the International Space Station at night. Calcutta’s center lies on the Eastern bank of the Hooghly river, with human activity following the river up to the North.

Other features that can be seen at night are the main roads and infrastructure around the city. The 117 road leads South to the Bay of Bengal. The three bridges that cross the Hooghly river can be seen as bars of lights. The Northern-most bridge leads to Calcutta international airport, Netaji Subhash Airport or Dum Dum Airport.

This image was taken with the Nightpod camera-stand that tracks the movement of Earth passing under the International Space Station at 28 800 km/h, keeping any target fixed in the middle of the viewfinder. Standard cameras fixed to Nightpod can take pictures with longer exposure times so astronauts can take sharper pictures of cities at night.

Photo credit: ESA/NASA

Saturday, January 18, 2014

Krakow, Poland


The snow-covered southern Polish city of Kraków is pictured in this image from the Kompsat-2 satellite.

The Vistula River snakes across the top of the image. The part of the river pictured flows from west to east as it winds northwards and empties into the Baltic Sea (not visible).

Kraków sits in a valley at the foot of the Carpathian Mountains and has a number of important nature reserves of great ecological value. Dubbed the European Capital of Culture in 2000, the city has an extensive cultural heritage across the epochs of Gothic, Renaissance and Baroque architecture, and is home to one of the oldest universities in the world: Jagellonian University.

Just north of the river at the center-left portion of the image is the medieval Old Town or historic central district. The area is home to Europe’s largest market square, along with numerous historic houses, palaces and churches.

Listed as a UNESCO World Heritage Site since 1978, the Old Town was the center of Poland’s political life until King Sigismund III Vasa moved his court to Warsaw in the late 1500s.

This image was acquired on 5 February 2010 by the Korea Aerospace Research Institute’s Kompsat-2 satellite.

Image credit: KARI/ESA

Saturday, January 11, 2014

Guinea-Bissau and the Bissagos Islands


The coast of Guinea-Bissau in West Africa is pictured in this image from the Landsat-8 satellite. Mangrove swamps are abundant along this coastline, acting as important feeding grounds for fish, birds and animals.

Flowing from the east, the Geba River empties into the Atlantic Ocean, with the country’s capital city of Bissau located on the river estuary. The city appears as a light brown area in the upper-central portion of the image.

Off the coast in the lower-left section of the image are the Bissagos (or Bijagós) islands – an archipelago of over 80 islands and islets. In 1996 the archipelago was declared a UNESCO Biosphere Reserve.

A diversity of mammals, reptiles, birds and fish can be found on the islands, including protected or rare species such as the Nile crocodile, hippopotamus, African manatee and the common bottlenose dolphin.

The archipelago has also been recognized as an important site for green sea turtles to lay their eggs.

In the lower left corner, the island of Orango looks like a tree, with the waterways like branches and land appears as foliage. This island is the center of a national park, and is known for its matrimonial tradition where marriage is formally proposed by the women – who are also responsible for building the homes.

This image was acquired by Landsat-8 satellite’s Operational Land Imager on 3 May 2013 and it is featured in the Earth from Space video program.

Image credit: USGS/ESA

Thursday, January 9, 2014

Kalgoorlie-Boulder, Australia


Kalgoorlie-Boulder is a city in the Goldfields-Esperance region of Western Australia. The town was founded in 1893 when gold was discovered in the so-called "Golden Mile." The area boomed, with an area population of over 200,000; by 1903 Kalgoorlie grew to 30,000, close to its present population. The concentrated area of large gold mines is considered to be the richest square mile on earth. The image was acquired November 26, 2013, covers an area of 20.2 x 21.9 km, and is located at 30.8 degrees south, 121.5 degrees east.

Image credit: NASA/JPL-Caltech

Sunday, December 22, 2013

Cloudy Fishing Over China


This Nightpod image taken from the International Space Station is not an interstellar cloud formation but artificial light over a cloudy China.

Nightpod is a camera stand that helps astronauts take sharper images of night-time Earth by compensating for the motion of the Station as it orbits our planet at 28,800 km/h.

This image was taken as the Space Station was flying northwest over the Chinese coast. The lights from cities or fishing boats are dispersed by clouds to create the Nebula-like effect. An astronaut from Expedition 30/31 took the picture on 21 March 2012 as the orbital outpost flew towards Shanghai, China.

Photo credit: ESA/NASA

Saturday, December 21, 2013

Westfjords Peninsula, Iceland


This Envisat image was acquired over the Westfjords peninsula in northwest Iceland.

Located in the North Atlantic Ocean east of Greenland and immediately south of the Arctic Circle, Iceland is the westernmost European nation, and has more land covered by glaciers than the whole of continental Europe. The country sits on the mid-Atlantic Ridge, where two tectonic plates are moving away from each other, causing strong geothermal and volcanic activity.

The grey area that is somewhat shaped like a Christmas tree is land, while the colorful spaces between the 'branches' are long fjords – long, narrow arms of the sea that stretch far inland.

During the ice ages both ice and rivers carved deep valleys in the mountains. As the climate changed, most of the ice melted, and the valleys were gradually filled with salt water from the coast, giving birth to the fjords.

The white dots along one of the fjords close to the center of the image are radar reflections from Westfjords peninsula’s largest town, Ísafjörður. More radar reflections from other towns can also be seen scattered along the coastline.

This image, also featured in the Earth from Space video program, was created by combining three Envisat radar acquisitions from 11 September 2004, 14 April 2007 and 3 May 2008 over the same area.

Image credit: ESA

Thursday, December 19, 2013

Mount Etna Eruption


Mount Etna on the Italian island of Sicily is Europe's most active volcano. Its latest series of eruptions has continued for weeks, producing ash clouds that forced the closure of nearby Catania airport; lava flows that stretched from the summit to the south and southeast; and spectacular fire fountains. In this nighttime thermal image acquired December 12, 2013 by the Advanced Spaceborne Thermal Emission and Reflection Radiometer (ASTER) instrument on NASA's Terra spacecraft, the lava flows are white (hot), emanating from the southeast crater. The image covers an area of 19.5 by 19.5 miles (31.5 by 31.5 kilometers), and is located at 37.7 degrees north latitude, 15 degrees east longitude.

Image credit: NASA/GSFC/METI/ERSDAC/JAROS, and U.S./Japan ASTER Science Team

Tuesday, December 17, 2013

Checkerboard Logging on the Idaho-Montana Border


Logging operations have left a striking checkerboard pattern in the landscape along the Idaho-Montana border, sandwiched between Clearwater and Bitterroot National Forests. The 1 x 1 mile squares are harvested at different times, producing a pattern of varied timber density and re-growth stages. The image was acquired July 30, 2012, covers an area of 23 x 20 km, and is located at 46.6 degrees north, 114.5 degrees west.

Image credit: NASA/GSFC/METI/ERSDAC/JAROS, and U.S./Japan ASTER Science Team

Saturday, December 14, 2013

Flinders Ranges, Australia


This image from Japan’s ALOS satellite shows part of the Flinders Ranges in South Australia, about 500 km north of Adelaide.

The area pictured is between Flinders Ranges National Park to the south, Vulkathunha-Gammon Ranges National Park to the north and Lake Frome due east (none of which is pictured).

The curving structures that dominate this image are part of a larger geosyncline – a subsiding linear trough in Earth’s crust – that includes the Flinders Ranges. The geosyncline consists of sedimentary rocks in a basin that were folded about 500 million years ago and have been eroded to the current landscape. In this image, the different colors show the different layers of rock.

Some of the oldest fossilised animal life have been found in parts of the Flinders Ranges.

Running up the middle of this image is a long, narrow gorge – typical of the ranges.

Along the right side of the image, the terrain is flat with a long, straight road running north–south. Numerous creeks appear like veins across the entire image.

The Flinders Ranges is one of Australia’s most seismically active regions, with numerous small earthquakes recorded every year.

Japan’s Advanced Land Observation Satellite captured this image on 3 January 2009. ALOS was supported as a Third Party Mission, which means that ESA used its multi-mission ground systems to acquire, process, distribute and archive data from the satellite to its user community.

This image is featured on the Earth from Space video program.

Image credit: JAXA/ESA

Friday, December 13, 2013

Greater London


This image taken from the International Space Station shows the metropolis of London and its surroundings. The area is characterized by the M25 orbital motorway that encircles the city and the Thames river winding its way to the Eastern coast. As no streetlamps or other sources of light illuminate the Thames it appears as a black curving line leaving the intense white light of the inner city towards the right. Other areas without light include parks and other bodies of water, notably the large Hyde Park and Regent’s Park to the left of the City Centre and the William Girling and King George’s Reservoirs that supply London with drinking water.

Heading due South from London, down and slightly to the left on this image, is the M23 road to Gatwick international airport and the town of Crawley. The lights of Gatwick Airport shine brighter than the 100,000-inhabitant town. Airports are brightly-lit and easily recognizable from above so pilots can safely direct their aircraft to land. London’s Heathrow airport including the two main runways can be seen at the left of London City Centre.

Continuing south past Crawley to the English Channel, the seaside town of Brighton can be seen merging with Worthing to the left as one continuous stream of light.

ESA’s Nightpod camera aid helps astronauts track objects on Earth from the International Space Station. Following Earth’s motion automatically, the tripod creates clear images in low lights with off-the-shelf professional cameras – 400 km above our planet.

Photo credit: ESA/NASA

Thursday, December 12, 2013

Thinning Antarctic Ice


Three years of measurements from CryoSat show that the West Antarctic Ice Sheet is estimated to be losing over 150 cubic kilometers of ice each year.

Image credit: CPOM/ESA

Wednesday, December 11, 2013

The Coldest Place on Earth


With remote-sensing satellites, scientists have found the coldest places on Earth, just off a ridge in the East Antarctic Plateau. The coldest of the cold temperatures dropped to minus 135.8 F (minus 93.2 C) -- several degrees colder than the previous record.

What is the coldest place on Earth? It is a high ridge in Antarctica on the East Antarctic Plateau where temperatures in several hollows can dip below minus 133.6 degrees Fahrenheit (minus 92 degrees Celsius) on a clear winter night.

Scientists made the discovery while analyzing the most detailed global surface temperature maps to date, developed with data from remote sensing satellites including the new Landsat 8, a joint project of NASA and the U.S. Geological Survey (USGS). Ted Scambos, lead scientist at the National Snow and Ice Data Center in Boulder, Colorado, joined a team of researchers reporting the findings Monday at the American Geophysical Union meeting in San Francisco.

Researchers analyzed 32 years' worth of data from several satellite instruments. They found temperatures plummeted to record lows dozens of times in clusters of pockets near a high ridge between Dome Argus and Dome Fuji, two summits on the ice sheet known as the East Antarctic Plateau. The new record of minus 136 F (minus 93.2 C) was set August 10, 2010.

That is several degrees colder than the previous low of minus 128.6 F (minus 89.2 C), set in 1983 at the Russian Vostok Research Station in East Antarctica. The coldest permanently inhabited place on Earth is northeastern Siberia, where temperatures in the towns of Verkhoyansk and Oimekon dropped to a bone-chilling 90 degrees below zero Fahrenheit (minus 67.8 C) in 1892 and 1933, respectively.

"We had a suspicion this Antarctic ridge was likely to be extremely cold, and colder than Vostok because it's higher up the hill," Scambos said. "With the launch of Landsat 8, we finally had a sensor capable of really investigating this area in more detail."

The quest to find out just how cold it can get on Earth -- and why -- started when the researchers were studying large snow dunes, sculpted and polished by the wind, on the East Antarctic Plateau. When the scientists looked closer, they noticed cracks in the snow surface between the dunes, possibly created when wintertime temperatures got so low the top snow layer shrunk. This led scientists to wonder what the temperature range was, and prompted them to hunt for the coldest places using data from two types of satellite sensors.

They turned to the Moderate Resolution Imaging Spectroradiometer (MODIS) instruments on NASA's Terra and Aqua satellites and the Advanced Very High Resolution Radiometer (AVHRR) on several National Oceanic and Atmospheric Administration satellites. These sensitive instruments can pick up thermal radiation emitted from Earth's surface, even in areas lacking much heat.

Using these sensors to scan the East Antarctic Plateau, Scambos detected extremely cold temperatures on a 620-mile stretch of the ridge at high elevations between Argus and Fuji, and even colder temperatures lower elevations in pockets off the ridge. Then, with the higher resolution of the Thermal Infrared Sensor (TIRS) aboard Landsat 8, the research team pinpointed the record-setting pockets.

The team compared the sites to topographic maps to explore how it gets so cold. Already cold temperatures fall rapidly when the sky clears. If clear skies persist for a few days, the ground chills as it radiates its remaining heat into space. This creates a layer of super-chilled air above the surface of the snow and ice. This layer of air is denser than the relatively warmer air above it, which causes it to slide down the shallow slope of domes on the Antarctic plateau. As it flows into the pockets, it can be trapped, and the cooling continues.

"By causing the air to be stationary for extended periods, while continuing to radiate more heat away into space, you get the absolute lowest temperatures we're able to find," Scambos said. "We suspected that we would be looking for one magical site that got extremely cold, but what we found was a large strip of Antarctica at high altitude that regularly reached these record low temperatures."

The study is an example of some of the intriguing science possible with Landsat 8 and the TIRS instrument, which was built at NASA’s Goddard Space Flight Center in Greenbelt, Maryland. Since its launch February 11, Landsat 8 has captured approximately 550 scenes per day of Earth's land surface. USGS processes, archives and distributes the images free of charge over the Internet.

"With Landsat 8, we expect to see more accurate and more detailed maps of the landscape than we've ever been able to see," said James Irons, the mission's project scientist at Goddard. "If change is occurring, I think we'll be able to detect it earlier and track it."

Researchers also are eager to see what new results come out of Landsat 8, both from icy plateaus and Earth's warmer regions.

"What we've got orbiting Earth right now is a very accurate and consistent sensor that can tell us all kinds of things about how the land surface of Earth is changing, how climate change is impacting the surface of Earth, the oceans of Earth, and the icy areas of Earth," Scambos said. "Finding the coldest areas on Earth is just the beginning of the discoveries we're going to be able to make with Landsat 8."

Image credit: Ted Scambos, National Snow and Ice Data Center; text credit: NASA

Tuesday, December 10, 2013

Spatial Distribution of the Tuolumne River Basin


Spatial distribution of snow water equivalent across the Tuolumne River Basin from April 10 to June 1, 2013 as measured by NASA's Airborne Snow Observatory.

Flying aboard a Twin Otter aircraft, the Airborne Snow Observatory measures two properties most critical to understanding snowmelt runoff and timing: snow depth and snow reflectivity. By combining snow depth with estimated density, snow water equivalent -- the amount of water in the snow -- is derived and used to calculate the amount of water that will run off. Snow reflectivity, or albedo, is the fraction of the incoming amount of sunlight reflected by snow. Subtracting reflected sunlight from incoming sunlight gives the absorbed sunlight, which largely controls the speed of snowmelt and timing of its runoff.

Map credit: NASA/JPL-Caltech

Note: For more information, see NASA Snow Mapper Reaps Big Benefits for California.

Saturday, December 7, 2013

Totten Glacier Ice Shelf


This image shows the Totten Glacier ice shelf in East Antarctica (the wrinkled white area at top left) on September 25, 2013. Two large open-water polynyas appear on the sea ice below and to the right of the shelf, as well as several smaller ones. The open-water areas are bright black. The stippled diagonal line from lower left to upper right is the outer edge of the sea ice, with cloud cover to the right of that line. The image is from the Moderate Resolution Imaging Spectroradiometer instrument on NASA's Aqua satellite.

Photo credit: NASA

Note: For more information, see NASA Finds Reducing Salt Is Bad for Glacial Health.

Friday, December 6, 2013

Ivanpah Solar Energy Plant, California


In September 2013 the largest solar plant of its kind in the world started producing power in southern California's Mojave Desert near the Nevada border. The Ivanpah Solar Electric Generating System uses 170,000 mirrors to focus the sun's heat on giant boilers atop 120m concrete towers, where water is turned into steam to power turbines that generate electricity. The 392 megawatt plant will generate enough electricity to power 140,000 homes. The image was acquired May 30, 2013, covers an area of 14.4 x 15.7 km, and is located at 35.5 degrees north, 115.5 degrees west.

Photo credit: NASA/GSFC/METI/ERSDAC/JAROS, and U.S./Japan ASTER Science Team

Wednesday, December 4, 2013

Gravity Scar from the March 2011 Japanese Earthquake


Changes in Earth’s gravity field resulting from the earthquake that hit Japan on 11 March 2011 (mE=10-12s-2). A combination of data from ESA’s GOCE mission and the NASA–German Grace satellite, shows the ‘vertical gravity gradient change’. The 'beachball' marks the epicenter.

Image credit: DGFI/TU Delft

Saturday, November 30, 2013

Aorounga Crater, Chad


This image from Japan’s ALOS satellite shows the Aorounga Crater in northern Chad.

The crater is just south of the Tibesti Mountains, a range of inactive – with some potentially active – volcanoes in the central Sahara desert.

Measuring about 12 km across, the crater was created by a meteorite impact about 340 million years ago.

Clearly visible is the dark, central peak, caused by material splashing up after the impact, similar to how water bounces back up when a stone is thrown in. This peak is surrounded by a low, sand-filled ring, which is surrounded by another ring of rock from when the material was thrown outwards. A distinctive low, sand-filled trough circles the others – the outer edges of the initial impact.

The linear rock ridges that run diagonally across this image are ‘yardangs’ and are formed by wind erosion. Here, we can clearly see how the wind blows from northeast to southwest. Sand dunes form in the wind-cut valleys between the rock ridges of the yardangs.

Japan’s Advanced Land Observation Satellite captured this image on 3 November 2010. ALOS was supported as a Third Party Mission, which means that ESA used its multimission ground systems to acquire, process, distribute and archive data from the satellite to its user community.

This image is featured on the Earth from Space video program.

Photo credit: JAXA/ESA