Saturday, August 31, 2013

Anatolia's Lakes Tersakan and Tuz


This ALOS image was acquired over Anatolia’s dry, central plateau in Turkey. On the left side we can see the whole of Lake Tersakan, with part of Lake Tuz in the upper right corner.

Lake Tuz is Turkey’s second largest lake, as well as one of the largest saline lakes in the world. During the summer months, however, the lake water recedes to expose a thick layer of salt.

The bright white surface during these dry summer months has been used by Earth-observing satellites to calibrate their sensors for the color white – much like how you would adjust a camera’s white balance setting.

Japan’s Advanced Land Observing Satellite (ALOS) captured this image on 21 October 2010 with its Advanced Visible and Near Infrared Radiometer type-2 instrument.

This image is featured on the Earth from Space video program.

Photo credit: JAXA, ESA

Friday, August 30, 2013

Greenland's Hidden Grand Canyon


Hidden for all of human history, a 460 mile long canyon has been discovered below Greenland's ice sheet. Using radar data from NASA's Operation IceBridge and other airborne campaigns, scientists led by a team from the University of Bristol found the canyon runs from near the center of the island northward to the fjord of the Petermann Glacier.

A large portion of the data was collected by IceBridge from 2009 through 2012. One of the mission's scientific instruments, the Multichannel Coherent Radar Depth Sounder, operated by the Center for the Remote Sensing of Ice Sheets at the University of Kansas, can see through vast layers of ice to measure its thickness and the shape of bedrock below.

Video credit: NASA

Note: For more information, see Mega-Canyon Discovered Beneath Greenland Ice.

Wednesday, August 28, 2013

The Spread of Western Wildfire Pollution


A new movie produced with data from the Atmospheric Infrared Sounder (AIRS) instrument on NASA's Aqua spacecraft shows the spread of carbon monoxide pollution across North America from fires in the Western U.S., including the Beaver Creek Fire in Idaho and the Rim Fire in California. The movie shows carbon monoxide concentrations at altitude 18,000 feet (5.5 kilometers) as measured by AIRS.

About AIRS
The Atmospheric Infrared Sounder, AIRS, in conjunction with the Advanced Microwave Sounding Unit, AMSU, senses emitted infrared and microwave radiation from Earth to provide a three-dimensional look at Earth's weather and climate. Working in tandem, the two instruments make simultaneous observations all the way down to Earth's surface, even in the presence of heavy clouds. With more than 2,000 channels sensing different regions of the atmosphere, the system creates a global, three-dimensional map of atmospheric temperature and humidity, cloud amounts and heights, greenhouse gas concentrations, and many other atmospheric phenomena. Launched into Earth orbit in 2002, the AIRS and AMSU instruments fly onboard NASA's Aqua spacecraft and are managed by NASA's Jet Propulsion Laboratory in Pasadena, Calif., under contract to NASA. JPL is a division of the California Institute of Technology in Pasadena.

Video credit: NASA/JPL-Caltech

Saturday, August 24, 2013

CERN and Geneva, Switzerland


The CERN Large Hadron Collider is the world's largest and highest-energy particle accelerator. Built from 1998 to 2008, this year it was the site of the confirmation of the existence of the Higgs Boson, proposed by Peter Higgs in 1964. The accelerator lies in a tunnel 27 km in circumference (shown by the yellow circle), as deep as 175 m beneath the French-Swiss border northwest of Geneva. The image was acquired July 26, 2012, covers an area of 14.2 x 15.4 km, and is located at 46.3 degrees north latitude, 6.2 degrees east longitude.

Photo credit: NASA/GSFC/METI/ERSDAC/JAROS, and U.S./Japan ASTER Science Team

Tuesday, August 20, 2013

Changes in Australia's Mass, June 2010 to February 2011


Changes in Australia's mass as reported by data from NASA's Gravity Recovery and Climate Experiment (GRACE) satellites from June 2010 to February 2011. Areas in greens and blues depict the greatest increases in mass, caused by excessive precipitation. The contour lines represent various land surface elevations. A new study co-authored and co-funded by NASA finds extensive flooding in Australia, combined with the continent's soils and unique topography, were the biggest contributors to the drop in global sea level observed in 2010 and 2011.

Image credit: NCAR/NASA/JPL-Caltech

Note: For more information, see Littlest Continent Had Biggest Role in Sea Level Drop.

Saturday, August 17, 2013

Star Dunes in the Algerian Sahara


Radially symmetrical, star dunes are pyramidal sand mounds with slipfaces on three or more arms that radiate from the high center of the mound. They tend to accumulate in areas with multidirectional wind regimes. Star dunes grow upward rather than laterally. They dominate the Grand Erg Oriental of the Algerian Sahara, as depicted in this image acquired October 27, 2012. It covers an area of 37 x 43 km, and is located at 29.8 degrees north latitude, 7.9 degrees east longitude.

Photo credit: NASA/GSFC/METI/ERSDAC/JAROS, and U.S./Japan ASTER Science Team

Saturday, July 27, 2013

Northwestern Greece


The northwestern part of Greece is pictured in this image acquired on 28 April by the Landsat-8 satellite. The Ionian Sea dominates the left side of the image, with the Ambracian Gulf near the center. In the upper-left corner we can see the Paxi islands. Paxos, to the north, boasts beautiful beaches mainly along its eastern coast, with dramatic cliffs and caves dominating the west side. The smaller island to the south, Antipaxos, is also known for its beaches as well as its traditional vineyards.

This image is featured on the Earth from Space video program.

Photo credit: USGS

Thursday, July 18, 2013

Typhoon Soulik


The swirling eye of Typhoon Soulik as it approached Taiwan last Friday is caught by a tiny espresso cup-sized camera on one of ESA’s smallest satellites, Proba-2. This X-Cam image of Typhoon Soulik was acquired on 12 July at 10:14 GMT. Less than a cubic meter in size, Proba-2 focuses on observing solar activity and space weather. But it also keeps a small eye on its homeworld. Among the 17 experimental technologies hosted on Proba-2 is the compact Exploration Camera, X-Cam. Housed on the underside of the satellite, the monochrome X-Cam observes in the visible and infrared with a 100° field of view.

Photo credit: ESA

Saturday, July 13, 2013

Raystown Lake, Pennsylvania


This Envisat radar image is centered on the man-made Raystown Lake in the US state of Pennsylvania. Near the top of the lake – which appears as a snaking red and blue line – there is a bright white radar reflection from the Raystown Dam. The area pictured is part of the greater Valley and Ridge Appalachians, in the Appalachian Mountain range. The lines that cut through the image are the long, even ridges characteristic of this region. One of the significant ridges is Tuscoarora Mountain in the lower-right corner. This is a compilation of three radar images from 23 December 2007, 2 March 2008 and 11 May 2008.

This image is featured on the Earth from Space video program.

Image credit: ESA

Wednesday, July 10, 2013

Kirkenes, Norway


The town of Kirkenes in northernmost Norway, with its 3400 inhabitants, is preparing for an expected boom as a shipping hub, as global warming has led to the opening up of the Northern Sea Route along Russia's Arctic coastline. The travel time between Tokyo and Hamburg, for example, has been cut 40%. Ten to fifteen percent of Chinese international trade could take this route by 2020, according to the director of the Chinese Polar Research Institute. The image was acquired May 19, 2003, covers an area of 24 x 25.5 km, and is located at 69.7 degrees north latitude, 30 degrees east longitude.

Image credit: NASA/GSFC/METI/ERSDAC/JAROS, and U.S./Japan ASTER Science Team

Tuesday, July 9, 2013

Flooding Along the Parana River


Heavy rains, which began in mid-June, have resulted in major flooding along the Parana River in Argentina. Thousands of people have been forced to evacuate their homes in cities along the river. The neighboring countries of Paraguay, Uruguay and Brazil have also been affected. Vegetated areas are shown in shades of red; the river and flooded areas are blue and turquoise; clouds are white and light blue. This image from the Advanced Spaceborne Thermal Emission and Reflection Radiometer (ASTER) instrument, acquired on July 6, 2013, covers an area of 54 by 28.5 kilometers (33.5 by 17.7 miles), and is located at 28.2 degrees south latitude, 59.1 degrees west longitude.

Image credit: NASA/GSFC/METI/ERSDAC/JAROS, and U.S./Japan ASTER Science Team

Friday, July 5, 2013

Peruvian Foothills


The foothills of the Andes mountains near the southern coast of Peru were captured by the Kompsat-2 satellite on 4 May 2011. The Andes stretch about 7000 km from Venezuela down South America’s west coast to the top of Argentina. The mountain range is the result of the Nazca and Antarctic tectonic plates moving under the South American plate – a geological process called ‘subduction’. This process is also responsible for the Andes range’s volcanic activity.

Photo credit: KARI/ESA

Thursday, July 4, 2013

Silver Fire, New Mexico


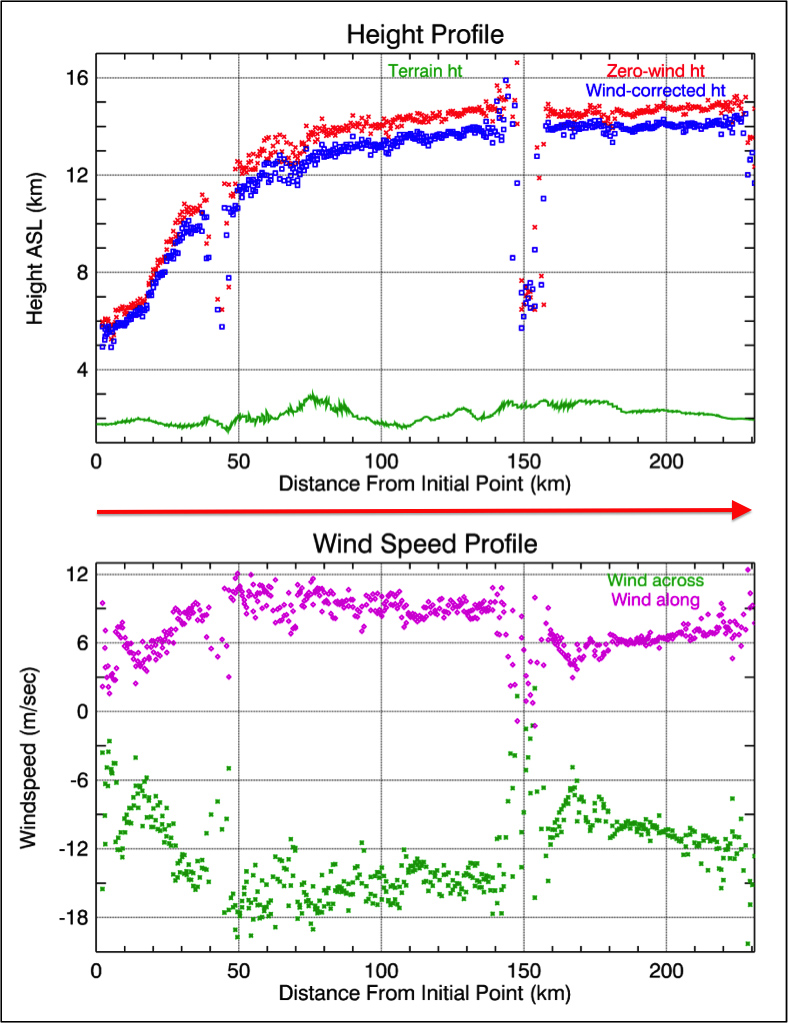
Lightning ignited the Silver Fire in western New Mexico on June 7, 2013. It has since consumed more than 137,000 acres of timber in a rugged area of the Gila National Forest that has not seen large fires for nearly a century. On the morning of June 28, as the fire exploded in intensity, NASA's Terra spacecraft passed over the fire, allowing the NASA Jet Propulsion Laboratory-built Multi-angle Imaging SpectroRadiometer (MISR) instrument on Terra to capture this image of extensive smoke. Two large pulses of fire generated pyro-cumulonimbus clouds. Brownish smoke, visible to the northwest of the active fire area, has entered the lower stratosphere. An active pulse of fire at the eastern end of this smoke is seen to be forming a new pyro-cumulonimbus tower that rises to a height of more than 8.7 miles (14 kilometers).

MISR views every scene it passes over from nine different angles. This unique design allows it to measure cloud and aerosol heights and the speed that smoke is moving due to horizontal wind using stereoscopic techniques. The plots in Figure 1 show the height of Silver Fire smoke along a line marked by the red arrow in the image. The profile crosses both smoke clouds, which rise to almost 9.3 miles (15 kilometers) in altitude above sea level (ASL). The lower plot shows the wind speeds retrieved by MISR in the direction across the image swath and in the direction along the satellite track.

These data were acquired during Terra orbit 71959.

Photo credit: NASA/GSFC/LaRC/JPL, MISR Team

Saturday, June 29, 2013

Vegetation in Syria, Turkey and Iraq


The recently launched Proba-V miniaturized satellite captured this image over the border region of northern Syria, southeastern Turkey and northern Iraq on 28 May. The area pictured is about 500 km across, with large reservoir lakes along the Euphrates River visible on the left, and another along the Tigris River on the right. In the central-right portion of the image, we can see Iraq’s Sinjar mountains. Proba-V will map land cover and vegetation growth across the entire planet every two days with its Vegetation imager. In this image, the contrast between the green areas – some with agricultural plots – and the sparsely vegetated areas is evident. It demonstrates Proba-V’s ability to see slight differences in vegetation cover. Vegetation intensity and health can help in crop yield predictions and to map interannual changes in vegetation cover.

This image is featured on the Earth from Space video program.

Photo credit: ESA

Wednesday, June 26, 2013

Sunday, June 23, 2013

Carstens, California Wildfire


The Carstens, California, wildfire continues to burn in the foothills west of Yosemite National Park. As of June 21, 2013, the fire had consumed 1,660 acres, and was 70 percent contained. In this image, acquired by the Advanced Thermal Emission and Reflection Radiometer (ASTER) instrument on NASA's Terra spacecraft, vegetation is displayed in green and burned and bare areas are dark to light gray. The data were acquired on June 20, 2013, and cover an area of 16 by 24 miles (26 by 39 kilometers).

Image credit: NASA/GSFC/METI/ERSDAC/JAROS, and U.S./Japan ASTER Science Team

Saturday, June 22, 2013

Barcelona, Spain


The Spanish city of Barcelona is pictured in this image captured on 13 September 2010 by Japan’s ALOS satellite. Near the top right corner, the circular Plaça de les GlĂ²ries Catalanes was meant to be the city center in the original urban plan. Dominating the left side of the image are the Garraf Massif mountains, their cliffs reaching the Mediterranean coast. Rock quarries and rubbish dumps are degrading the land here, and some of these degraded areas can be seen in the lower left corner as large yellow patches. Along the coast, we can see the Barcelona’s port – one of Europe’s top ten largest container ports. Barcelona-El Prat airport is about 10 km southwest of the city center, across the Llobregat River. On either side of the airport we can see the darker areas of the Llobregat delta.

Photo credit: JAXA/ESA

Saturday, June 15, 2013

Rates of Basal Melt of Antarctic Ice Shelves


Rates of basal melt of Antarctic ice shelves (melting of the shelves from underneath) overlaid on a 2009 mosaic of Antarctica created from data from NASA's Moderate Resolution Imaging Spectroradiometer (MODIS) instrument aboard NASA's Terra and Aqua spacecraft. Red shades denote melt rates of less than 5 meters (16.4 feet) per year (freezing conditions), while blue shades represent melt rates of greater than 5 meters (16.4 feet) per year (melting conditions). The perimeters of the ice shelves in 2007-2008, excluding ice rises and ice islands, are shown by thin black lines. Each circular graph is proportional in area to the total ice mass loss measured from each ice shelf, in gigatons per year, with the proportion of ice lost due to the calving of icebergs denoted by hatched lines and the proportion due to basal melting denoted in black.

Image credit: NASA/JPL-Caltech/UC Irvine/Columbia University

Note: For more information, see Warm Ocean Causing Most Antarctic Ice Shelf Mass Loss

Friday, June 14, 2013

New Zealand's South Island


New Zealand’s South Island is pictured in this Envisat image from 4 April 2012. There are a number of lakes throughout the island, but one that stands out in particular is Lake Pukaki, at the center of the image. The bright blue coloring of its waters comes from the extremely fine rock particles fed into the water from the glaciers. To the northeast, the light green coloring of Lake Ellesmere / Te Waihora can be seen. Peeking out from between the clouds to the south is Stewart Island/Rakiura – the country’s third largest island.

This image is featured on the Earth from Space video program.

Photo credit: ESA

Tuesday, June 11, 2013

Arctic Permafrost Zones


Permafrost zones occupy nearly a quarter of the exposed land area of the Northern Hemisphere. NASA's Carbon in Arctic Reservoirs Vulnerability Experiment is probing deep into the frozen lands above the Arctic Circle in Alaska to measure emissions of the greenhouse gases carbon dioxide and methane from thawing permafrost - signals that may hold a key to Earth's climate future.

Image credit: Hugo Ahlenius, UNEP/GRID-Arendal

Note: For more information, see Is a Sleeping Climate Giant Stirring in the Arctic? Also, Is Arctic Permafrost the "Sleeping Giant" of Climate Change?