Sunday, December 23, 2012

Altimeter Readings over Cuba


CryoSat altimeter view of sea level and topography over the Caribbean Sea and Cuba. The image shows radar reflections that differ in intensity between the water and elevated land. Near the edges of the island, points of high radar reflections are pictured in red. This is due to the higher reflectiveness of calm waters of the bay and over coral reefs.

Image credit: ESA

Saturday, December 22, 2012

Kangerdlugssuaq Glacier, Greenland


The Kangerdlugssuaq glacier and its ice stream are pictured in this week’s image, acquired on 19 September 2012 by Landsat-7. It is the largest outlet glacier on Greenland’s east coast, discharging ice into the surrounding oceans. In this image we can see hundreds of icebergs speckling the water. A recent study based on satellite observations revealed that over the past 20 years the ice melting in Greenland and Antarctica has contributed about 11 mm to the global sea-level rise. This image clearly shows the glacier’s calving front, where ice breaks away. Over the years, satellite images have shown that this front has retreated – an indication that the glacier is getting smaller over time.

This image is featured on the Earth from Space video program.

Photo credit: USGS/ESA

Saturday, December 15, 2012

Po River, Italy


This image is a compilation of three radar images from the Japanese ALOS satellite and shows the Po River, which flows over 650 km from west to east across northern Italy as the country’s longest river. Agriculture is one of the main economic uses of the Po Basin because of the fertile soils, and this image clearly shows a landscape dominated by fields. Branching off of the river in the center of the image and snaking through the landscape to the lower-right corner is the Po di Goro, one of the main channels of the Po Delta. The section of the main river pictured and the Po di Goro form the border of the Italy’s Veneto (north) and Emilia–Romagna (south) regions.

This image is featured on the Earth from Space video program.

Image credit: JAXA/ESA

Thursday, December 13, 2012

Concordia Base, Antarctica


The Proba-1 microsatellite's High Resolution Camera images the French-Italian Concordia base in the Antarctic interior. The image has 5-m spatial resolution and covers approximately 25 sq km. It was acquired on 24 November 2012.

Photo credit: ESA

Saturday, September 15, 2012

Gulf of Guinea


This Envisat image shows West Africa around the Gulf of Guinea, with parts of Nigeria to the north and Cameroon to the east visible. Cameroon’s largest city of Douala is located near the Wouri estuary near the center of the image. North of the Wouri estuary, the Mount Cameroon volcano is clearly visible. The island of Bioko is pictured just off the coast.

Reflections of Envisat’s radar signal appear like specks of white throughout the image. They are particularly concentrated around cities such as Malabo on the island, Douala near the Wouri estuary and the populated areas of southern Nigeria. These white specks are the typical appearance of built-up areas in radar images, owing to the multiple reflection of the radar beam by buildings and especially metal constructions.

This image is a compilation of three images from Envisat’s radar, acquired on 6 February, 7 March and 6 April 2012 – just two days before communication with the satellite was lost.

Image credit: ESA

Tuesday, September 11, 2012

Santorini Rising


Model of vertical movement across Santorini from January 2011 to present, derived from data from the Envisat and TerraSAR-X missions. Over the past year and a half, parts of Santorini have risen by 14 cm, such as the Kameni islands in the center. Scientists believe that new molten rock has been squeezing up beneath the volcano at a depth of about 4 km, pictured here as a red dot.

Image credit: M. Parks

Saturday, September 8, 2012

Chernozem Cropland


This ALOS satellite image shows an area with extensive agricultural use in western Russia, with roads and rivers cutting through the cropland. This area, part of Russia’s Black Earth Region, is about 400 km directly south of Moscow. Many grains are grown here, such as winter wheat and rye.

This image is a compilation of three passes by the Japanese Advanced Land Observation Satellite’s radar on 14 June 2009, 14 September 2009 and 2 August 2010. Each image at the different recording date is assigned a color (red, green or blue) and combined to produce this representation. The colors reveal changes in the surface between the satellite’s passes.

Photo credit: JAXA, ESA

Friday, September 7, 2012

Drought in Kansas: 2012 vs 2002


As the U.S. Midwest continues to suffer from near-historic drought conditions, farmers in southwestern Kansas are among the hardest hit. According to the U.S. Department of Agriculture, the area is under "exceptional drought" conditions. This has led to significant reductions of the corn, soybean and pea crops. The two satellite images shown here, obtained about 10 years apart, clearly illustrate the effects of the drought. The top half of this image was acquired on September 6, 2012 by the Advanced Spaceborne Thermal Emission and Reflection Radiometer (ASTER) instrument on NASA's Terra spacecraft; the bottom half of the image was acquired by the Landsat Thematic Mapper on September 15, 2002. Vegetation appears in red, and bare fields are gray or greenish in color. Both images cover an area of 9.3 by 27.9 miles (15 by 44.5 kilometers) and are located near 38.2 degrees north latitude, 100.8 degrees west longitude.

Image credit: NASA/GSFC/METI/ERSDAC/JAROS, and U.S./Japan ASTER Science Team

Tuesday, September 4, 2012

Arctic Ocean Ice Decrease, 1979-2010


This animation shows Arctic ice cover from 1978 to 2010. The past five years have seen the lowest Arctic sea-ice extent since satellite measurements began in the 1970s.

Video credit: ESA/DLR

Tuesday, August 14, 2012

Meteor Smoke and Noctilucent Clouds


Anyone who's ever seen a noctilucent cloud or “NLC” would agree: They look alien. The electric-blue ripples and pale tendrils of NLCs reaching across the night sky resemble something from another world.

Researchers say that's not far off. A key ingredient for the mysterious clouds comes from outer space.

"We've detected bits of 'meteor smoke' embedded in noctilucent clouds," reports James Russell of Hampton University, principal investigator of NASA's AIM mission to study the phenomenon. "This discovery supports the theory that meteor dust is the nucleating agent around which NLCs form."

Noctilucent clouds are a mystery dating back to the late 19th century. Northern sky watchers first noticed them in 1885 about two years after the eruption of Krakatoa. Ash from the Indonesian volcano caused such splendid sunsets that evening sky watching became a worldwide pastime. One observer in particular, a German named T.W. Backhouse who is often credited with the discovery of NLCs, noticed something odd. He stayed outside longer than most people, long enough for the twilight to fully darken, and on some nights he saw wispy filaments glowing electric blue against the black sky. Scientists of the day figured they were some manifestation of volcanic dust.

Eventually Krakatoa’s ash settled and the sunsets faded, but strangely the noctilucent clouds didn’t go away. They’re still present today, stronger than ever. Researchers aren’t sure what role Krakatoa’s ash played in those early sightings. One thing is clear, however: The dust behind the clouds we see now is space dust.

Mark Hervig of the company GATS, Inc, led the team that found the extraterrestrial connection.

"Using AIM's Solar Occultation for Ice Experiment (SOFIE), we found that about 3% of each ice crystal in a noctilucent cloud is meteoritic," says Hervig.

The inner solar system is littered with meteoroids of all shapes and sizes--from asteroid-sized chunks of rock to microscopic specks of dust. Every day Earth scoops up tons of the material, mostly the small stuff. When meteoroids hit our atmosphere and burn up, they leave behind a haze of tiny particles suspended 70 km to 100 km above Earth's surface.

It's no coincidence that NLCs form 83 km high, squarely inside the meteor smoke zone.

Specks of meteor smoke act as gathering points where water molecules can assemble themselves into ice crystals. The process is called "nucleation."

Nucleation happens all the time in the lower atmosphere. In ordinary clouds, airborne specks of dust and even living microbes can serve as nucleation sites. Tiny ice crystals, drops of water, and snowflakes grow around these particles, falling to Earth if and when they become heavy enough.

Nucleating agents are especially important in the ethereal realm of NLCs. The clouds form at the edge of space where the air pressure is little more than vacuum. The odds of two water molecules meeting is slim, and of sticking together slimmer still.

Meteor smoke helps beat the odds. According AIM data, ice crystals can grow around meteoritic dust to sizes ranging from 20 to 70 nanometers. For comparison, cirrus clouds in the lower atmosphere where water is abundant contain crystals 10 to 100 times larger.

The small size of the ice crystals explains the clouds' blue color. Small particles tend to scatter short wavelengths of light (blue) more strongly than long wavelengths (red). So when a beam of sunlight hits an NLC, blue is the color that gets scattered down to Earth.

Meteor smoke explains much about NLCs, but a key mystery remains: Why are the clouds brightening and spreading?

In the 19th century, NLCs were confined to high latitudes—places like Canada and Scandinavia. In recent times, however, they have been spotted as far south as Colorado, Utah and Nebraska. The reason, Russell believes, is climate change. One of the greenhouse gases that has become more abundant in Earth's atmosphere since the 19th century is methane. It comes from landfills, natural gas and petroleum systems, agricultural activities, and coal mining.

It turns out that methane boosts NLCs.

Russell explains: "When methane makes its way into the upper atmosphere, it is oxidized by a complex series of reactions to form water vapor. This extra water vapor is then available to grow ice crystals for NLCs."

If this idea is correct, noctilucent clouds are a sort of "canary in a coal mine" for one of the most important greenhouse gases.

And that, says Russell, is a great reason to study them. "Noctilucent clouds might look alien, but they're telling us something very important about our own planet."


Photo credit: NASA; video credit: NASA

Friday, August 3, 2012

London


Preparations for London's 2012 Summer Olympic Games began years before July 27th's opening ceremonies. The Games use a mixture of new venues, existing and historical facilities, and temporary facilities. Major construction projects included the new 400-acre Olympic Park, constructed on a former industrial site in the east of London.

This simulated natural color image of London was acquired May 26, 2012, by the Advanced Spaceborne Thermal Emission and Reflection Radiometer (ASTER) instrument on NASA's Terra spacecraft. It covers an area measuring 9.3 by 9.3 miles (15 by 15 kilometers), and is centered at 51.5 degrees North Latitude, 0.1 degree west longitude. The Olympic Park is visible in the upper right of the image.

Photo credit: NASA/GSFC/METI/ERSDAC/JAROS, and U.S./Japan ASTER Science Team

Sunday, July 29, 2012

Deforestation of the Amazon Rain Forest


This animation shows deforestation of the Amazon Rainforest in the western Brazilian state of Rondônia from 1986 to 2010. While the central area remains green and untouched, squares of light green and brown pop up over time as the forest is cut away.

The animation was created using two cloud-free images: the first from NASA’s Landsat mission in 1986, and the second from the Spanish Deimos mission in 2010. The changes over time were simulated by referring to other satellite data acquired during the 24 years between the two images.

Video credit: ESA/USGS/Deimos Imaging; text credit: ESA/USGS/Deimos Imaging

Sunday, July 22, 2012

Petermann Glacier


The Petermann Glacier grinds and slides toward the sea along the northwestern coast of Greenland, terminating in a giant floating ice tongue. Like other glaciers that end in the ocean, Petermann periodically calves icebergs. A massive iceberg, or ice island, broke off of the Petermann Glacier in 2010. Now, nearly two years later, another chunk of ice has broken free.

The Moderate Resolution Imaging Spectroradiometer, or MODIS, on NASA’s Aqua satellite observed the new iceberg calving and drifting downstream on July 16–17, 2012. Because Aqua is a polar-orbiting satellite, it makes multiple passes over the polar regions each day.

Photo credit: NASA

Saturday, July 14, 2012

Camargue Delta, France


This image from ALOS shows southern France and the divide of the Rhone River: the 'Grand Rhône' flows down the center of the image while the 'Petit Rhône' is visible to the west. This divide at the French city of Arles forms the Camargue delta region. In the upper right corner of the image, we can see the Alpilles mountains. The green area south of the mountains is a large nature reserve.

This image is a compilation of three radar passes on 14 May 2008, 20 May 2010 and 5 July 2010. Each is assigned a color (red, green or blue) and combined to produce this representation. The colors reveal changes in the surface between the satellite’s passes.

Photo credit: JAXA, ESA

Wednesday, July 11, 2012

The Wadi As-Sirhan Basin


Tapping into fossil ground water, Saudi Arabia has been steadily developing agricultural fields using center pivot irrigation. A remarkable example is in the Wadi As-Sirhan Basin in northwest Saudi Arabia. In the 1984 Landsat image (top), no fields are yet present. By 2000, ASTER showed extensive farming activity (middle); vegetation is bright red. And by 2011, the ASTER image shows several areas where wall-to-wall fields were developed, each about 1 km in diameter (bottom). The images cover an area of 19.5 x 33 km, and are located at 30.5 degrees north latitude, 38 degrees east longitude.

Photo credit: NASA/GSFC/METI/ERSDAC/JAROS, and U.S./Japan ASTER Science Team

Tuesday, July 10, 2012

Dawson, Canada


Dawson, Canada was a boom town in 1898, with a population of 40,000. Discovery of gold in the Klondike fueled the massive influx of miners, merchants, and other support professions to this town on the Yukon River. The current population is just over 1,000, with over 60,000 tourists invading the town each summer. Shortly after gold discovery, large gold dredges began an industrial mining operation, leaving large tailings piles in their wake. These can be clearly seen along the creek east of Dawson. The image was acquired September 19, 2010, and is located at 64.1 degrees north latitude, 136.4 degrees west longitude.

Photo credit: NASA/GSFC/METI/ERSDAC/JAROS, and U.S./Japan ASTER Science Team

Sunday, July 8, 2012

The Waldo Canyon Fire


The Waldo Canyon Fire, west of Colorado Springs, Colo., is being called the worst fire in Colorado history. Since its onset on June 23, 2012, the fire has consumed more than 18,000 acres and hundreds of homes. Containment of the fire is expected by July 6. In this image, acquired by the Advanced Spaceborne Thermal Emission and Reflection Radiometer (ASTER) instrument on NASA's Terra spacecraft on July 4, healthy vegetation is red, water is dark blue, streets and buildings are gray, and the burned areas are black. The image covers an area of 9.3 by 12.1 miles (15 by 18 kilometers) and is located at 36.9 degrees north latitude, 104.9 degrees west longitude.

Photo credit: NASA/GSFC/METI/ERSDAC/JAROS, and U.S./Japan ASTER Science Team

Saturday, July 7, 2012

Mont Saint Michel


This image acquired on 3 May 2012 from the Pleiades satellite shows the island of Mont Saint Michel and its surrounding bay in northwest France. Mont Saint Michel was a tidal island, meaning that it was surrounded by water at high tide and only when the waters receded was it reachable by foot. In the late 1800s, the causeway was raised to make it accessible from the mainland at all times. In this image, we can clearly see where the water meets the mud flats, with multiple channels weaving through the mud.

Photo credit: CNES 2012/Astrium Services/Spot Image

Saturday, June 30, 2012

Atacama Desert


The southern Atacama Desert is pictured in this Envisat image, with the border of Chile (west) and Argentina (east) running down the middle. The Atacama is believed to be the driest desert in the world, and the lack of cloud cover in this image highlights the dry climate.

This image was acquired by Envisat’s MERIS instrument on 4 March 2012.

Photo credit: ESA

Note: The Atacama desert is where the various telescopes for the European Southern Observatory are located; it is also where scenes for the James Bond movie, Quantum of Solace, were filmed.

Monday, June 25, 2012

New Estimate of Gross Carbon Emissions From Tropical Deforestation


Distribution of annual carbon emissions from gross forest cover loss between 2000 and 2005 mapped at a spatial resolution of 11.5 miles (18.5 kilometers).

Image credit: Winrock International

Note: For more information, see Study Slashes Deforestation Carbon Emission Estimate.

Sunday, June 24, 2012

Picher, Oklahoma


Picher, Oklahoma once boasted 20,000 people in this mining town in northeast Oklahoma. Now, after a 2009 tornado, and a federal cleanup program, the town is a modern-day ghost town. Picher lies in the middle of the Tar Creek Superfund site, an expanse of lead- and zinc-mining towns that extends into Missouri and Kansas. But mine cave-ins, sinkholes, and a creek that flows orange from pollution have forced abandonment of Picher and the surrounding smaller towns. The image was acquired July 12, 2006, covers an area of 17.7 by 16.8 km, and is located at 37 degrees north latitude, 94.8 degrees west longitude.

Photo credit: NASA/GSFC/METI/ERSDAC/JAROS, and U.S./Japan ASTER Science Team

Saturday, June 23, 2012

Lake Garda, Italy


Italy’s Lake Garda and the city of Verona south of the Italian Alps are pictured in this image from ALOS observation satellite. With an area of 370 sq km, Garda is the largest lake in Italy and the third largest in the Alpine region. East of the lake is the Adige River, flowing south before curving east toward Verona. The city of Verona has been awarded World Heritage Site status by UNESCO because of its urban structure and architecture – among them the circular Roman amphitheater, visible when zooming in.

Photo credit: JAXA/ESA

Sunday, June 17, 2012

NASA's Aquarius Maps Ocean Salinity Structure


New research using salinity data from NASA's Aquarius instrument on the Aquarius/SAC-D observatory has given scientists an unprecedented look at a key factor involved in the formation of an oceanic wave feature in the tropical Pacific and Atlantic Oceans that influences global climate patterns.

Tropical instability waves are westward-traveling waves that form along the interface between areas of cold and warm sea surface temperatures near the equator. Existing studies suggest that these waves can have wavelengths of 1,000-2,000 kilometers and have an average period between waves of about one month. These waves redistribute various properties of seawater within the ocean, including temperature, salinity, nutrients, and carbon. They interact with ocean currents, affect large-scale climate patterns such as El Niño and La Niña, and influence marine ecosystems and the carbon cycle.

Previous observations of tropical instability waves have been limited to satellite observations of sea surface temperature, sea level, ocean surface wind, and ocean surface chlorophyll abundance, as well as sparse direct ocean measurements. Salinity has been found to play an important role in the physics of these waves, and observations of their salinity are important to understanding them and their impacts on climate variability and prediction, and biogeochemistry. However, until now salinity observations of them have been limited to very sparse direct ocean measurements. Aquarius provides an unprecedented opportunity to observe their salinity.

In a study in press in the journal Geophysical Research Letters, a team led by Tong Lee of NASA's Jet Propulsion Laboratory, Pasadena, California, and including scientists from Earth & Space Research in Seattle, Aquarius data were used to reveal the salinity structure associated with tropical instability waves in the Pacific Ocean. The figure shows sea surface salinity (color shading in panels a and b) on December 18, 2011, derived from Aquarius measurements, showing the peaks and valleys of tropical instability waves in the eastern to central equatorial Pacific Ocean. The salinity structure is coherent with those obtained from other satellite derived products such as sea surface temperature (contour lines in panel a) and ocean surface currents (arrows in panel b). The unit for the sea surface salinity (SSS) is parts per thousand (the Practical Salinity Unit or PSU). The unit for sea surface temperature (SST) is degree centigrade.

The team found that Aquarius' salinity observations showed a clear signature of the waves near the equator in the Pacific Ocean where large contrasts in salinity occur between the saltier waters of the South Pacific and fresher waters of the North Pacific. The Aquarius data reveal that the waves move much faster at the equator than they do away from the equator, a feature that had not previously been well documented.

Aquarius observations show that near the equator, the waves have a dominant period of approximately 17 days. Aquarius' ability to reveal oceanic features on such short timescales was unexpected, as the mission was designed to study salinity changes on time scales of a month and longer. Salinity variability associated with tropical instability waves is larger near the equator, while sea surface temperature and sea level variability associated with the waves is larger a few degrees away from the equator. Salinity observations from Aquarius can therefore fill an important gap in studying tropical instability waves by providing measurements that are complementary to other satellite observations and direct ocean measurements.

Reference: Lee, T.; G. Lagerloef; M. Gierach; H.-Y. Kao; S. Yueh; and K. Dohan, 2012: "Aquarius reveals salinity structure of tropical instability waves," Geophysical Research Letters, in press.

Image credit: NASA/JPL-Caltech/GSFC

Saturday, June 16, 2012

The Paraná River


The Paraná River cuts through this image of southern Brazil, acquired by the MERIS instrument on Envisat on 19 March. In the area pictured, the river marks the borders of the Brazilian states of Mato Grosso do Sul to the north and west, São Paulo to the east and Paraná to the south.

Agricultural structures are evident in the surrounding land. Near the center of the image, smoke from a fire was captured blowing southwest from its source.

Photo credit: ESA

Sunday, June 10, 2012

A Crack on Pine Island Glacier


This Envisat image shows the Pine Island Glacier in West Antarctica and reveals a crack in the glacier’s tongue about 25 km long. The image was acquired by Envisat’s radar on 6 April 2012, just two days before contact with the satellite was lost.

Photo credit: ESA

Saturday, June 9, 2012

Eruption Plume from Sheveluch Volcano


On the night of June 2, 2012, a large eruption plume from eastern Russia's Sheveluch volcano was captured by the Advanced Spaceborne Thermal Emission and Reflection Radiometer (ASTER) instrument on NASA's Terra spacecraft. Sheveluch is one of the most active volcanoes on the Kamchatka peninsula, with frequent explosive events that can disrupt air traffic over the northern Pacific. In this color composite of three thermal infrared channels, the ash component of the plume is depicted in red, the water droplets and ice are in blue, and the sulfur dioxide (SO2) component is in yellow. The image is centered near 56.6 degrees north latitude, 161.4 degrees east longitude, and covers an area of 37 by 74 miles (60 by 120 kilometers).

Image credit: NASA/GSFC/METI/ERSDAC/JAROS, and U.S./Japan ASTER Science Team

Tuesday, June 5, 2012

Copenhagen, Denmark


Copenhagen, the capital of Denmark, is highlighted in this image. The largest city in Denmark, Copenhagen is located on the eastern side of the island of Zealand (left) and on the island of Amager (right). The island visible east of Amager is Saltholm, translated as ‘Salt Islet’. The white structure southwest of Saltholm is the artificial island of Peberholm, translated as ‘Pepper Islet’. Peberholm was created as part of the Øresund Bridge, a combined two-track rail and four-lane road bridge-tunnel across the Øresund Strait that connects Copenhagen with the Swedish city of Malmö (not visible). Peberholm serves as a crossover point between the bridge, completed in 2000, and the 4050-m long Drogden Tunnel. Copenhagen Airport is visible as an L-shaped, white structure on the eastern side of Amager.

Photo credit: CNES, Spot Image

Sunday, May 27, 2012

Mississippi River Delta


This Landsat image of 3 October 2011 shows the Mississippi River Delta, where the largest river in the United States empties into the Gulf of Mexico. In this false-color image, land vegetation appears pink, while the sediment in the surrounding waters are bright blue and green.

Photo credit: USGS/ESA

Saturday, May 26, 2012

Yarlung Zangpo Grand Canyon, Tibet


The Yarlung Zangpo Grand Canyon (or Tsangpo Gorge) in Tibet is the deepest canyon in the world, and longer than the Grand Canyon. As the river passes between the peaks of Namcha Barwa (7,782 m) and Gyala Peri (7,234 m) it reaches a maximum depth of 6,009 m. In 2002, seven kayakers were the first westerners to navigate the entire gorge. The image was acquired February 25, 2004, and is located near 29.7 degrees north latitude, 95 degrees east longitude.

Photo credit: NASA/GSFC/METI/ERSDAC/JAROS, and U.S./Japan ASTER Science Team

Friday, May 25, 2012

Ground Deformation at the Nea Kameni Volcano


Evolution of ground deformation over Nea Kameni Volcano (Santorini, Greece) from March 2011 to February 2012. The animation was derived using data from Differential Interferometric Synthetic Aperture Radar analysis of Envisat’s radar data.

Video credit: ESA

Note: This particular island is famous for the volcanic eruption that destroyed the Minoan civilization living on the island of Thera, as Santorini was known at the time. The artwork that was preserved by the eruption is very beautiful.

Thursday, May 17, 2012

Texas Wildfires


The Livermore and Spring Ranch fires near the Davis Mountains Resort, Texas, burned 13,000 and 11,000 acres respectively. The fires started on April 21, 2012, by dry lightning. By May 12, when this image from the Advanced Spaceborne Thermal Emission and Reflection Radiometer (ASTER) instrument on NASA's Terra spacecraft was acquired, both fires were contained, and management had been turned over to local authorities. The image shows healthy vegetation in red, burned areas in black, and bare ground in blue-gray and yellow-tan. The image covers an area of 13.6 by 17.8 miles (22 by 28.5 kilometers) and is located at 30.7 degrees north latitude, 104.2 degrees west longitude.

Photo credit: NASA/GSFC/METI/ERSDAC/JAROS, and U.S./Japan ASTER Science Team

Wednesday, May 16, 2012

Three Gorges Dam, China


The Three Gorges Dam spans the Yangtze River in east-central China, and is the world's largest power station in terms of installed capacity, with its vast reservoir stretching for 660 km. Since its completion in 2008, over 1.3 million people were relocated; 13 cities, 140 towns, and 1350 villages were submerged; and the cost of the project exceeded $40 billion. According to the BBC News, landslides and bank collapses upriver from the dam may force authorities to move another 100,000 people. The image was acquired June 24, 2009, and is located at 30.8 degrees north latitude, 111 degrees east longitude.

Photo credit: NASA/GSFC/METI/ERSDAC/JAROS, and U.S./Japan ASTER Science Team

Saturday, May 12, 2012

Hot Spots in Northern France


This animation shows two images of northern France acquired by two different instruments on the Envisat satellite: MERIS and the Advanced Along-Track Scanning Radiometer.

The first image, acquired on 20 February 2012, shows Paris in the center. The river flowing through the city and into the English Channel is the Seine. East of Paris, vineyards and fields of the famous Champagne-Ardenne region appear lighter in color. The second radiometer image, acquired on 23 May 2011, shows heat, with yellows and reds depicting higher temperatures compared to the cooler blue areas. In this image, urban areas south of Paris – such as Orléans – stand out.

Video credit: ESA; text credit: ESA

Tuesday, May 1, 2012

Gulf of Fonseca, Honduras


The eastern end of the Gulf of Fonseca, in Honduras, was originally the site of extensive wetlands ecosystem, dominated by six species of mangroves. In 1986 (right image), the Landsat Thematic Mapper shows an environment minimally impacted by human activities. By 2009, when the ASTER image was acquired (left), hundreds of square kilometers of coastal swamps had been converted to shrimp ponds, appearing as blue rectangles near the water line. The images cover an area of 30 x 36 km, and are located at 13 degrees north latitude, 87.2 degrees west longitude.

Photo credit: NASA/GSFC/METI/ERSDAC/JAROS, and U.S./Japan ASTER Science Team

Thursday, April 26, 2012

Popocatepetl Volcano


Mexico's active Popocatepetl volcano, located about 40 miles southeast of Mexico City, has been spewing water vapor, gas, ashes and glowing rocks since its most recent eruption period began in April 2012. Civil defense authorities have set up evacuation shelters should they become necessary. In 2000, eruptions of the nearly 18,000-foot-high (5,400 meter) volcano led to the evacuation of tens of thousands of residents. More than 30 million people live within sight of the mountain.

The Advanced Spaceborne Thermal Emission and Reflection Radiometer (ASTER) instrument on NASA's Terra spacecraft acquired these two images on April 23, 2012. The left image is in simulated natural color; the right image combines three thermal infrared channels, displaying the eruption plume in purple and pink, blowing toward the northeast. A small hotspot can be seen in the summit crater. The image covers an area of 19.2 by 27.6 miles (30 by 44.5 kilometers) and is located at 19 degrees north latitude, 98.6 degrees west longitude.

Photo credit: NASA/GSFC/METI/ERSDAC/JAROS, and U.S./Japan ASTER Science Team

Tuesday, April 24, 2012

Moskva at Night


Moscow appears at the center of this nighttime image photographed by the Expedition 30 crew aboard the International Space Station, flying at an altitude of approximately 240 miles on March 28, 2012. A solar array panel for the space station is on the left side of the frame. The view is to the north-northwest from a nadir of approximately 49.4 degrees north latitude and 42.1 degrees east longitude, about 100 miles west-northwest of Volgograd. The Aurora Borealis, airglow and daybreak frame the horizon.

Photo credit: NASA

Tuesday, April 17, 2012

Portugal and Spain


Envisat’s Medium Resolution Imaging Spectrometer (MERIS) captured this image on 8 April 2012 at 13:05 CEST. The image was transmitted in Ka-band to ESA/ESRIN though direct transmission via Artemis, the ESA Data Relay satellite. The image, which is of nominal quality, shows Portugal and Spain. It is the last Envisat data transmitted via Ka-band before the communication anomaly affected the Envisat satellite.

Photo credit: ESA

Monday, April 16, 2012

Greenland Coast


The west coast of Greenland is one of Earth's premiere incubators for icebergs, large blocks of land ice that break off from glaciers or ice shelves and float in the ocean, where they are transported by winds and currents and can pose potential threats to shipping. The Advanced Spaceborne Thermal Emission and Reflection Radiometer (ASTER) instrument on NASA's Terra spacecraft captured this image of icebergs off the west coast of Greenland, on July 17, 2005. The largest iceberg in the image, seen in the top center of the image coming off of a glacier, is about 4,128 feet (1,270 meters) in length. The image covers an area of 26.8 by 29.3 miles (43.2 by 47.2 kilometers), and is located at 74.6 degrees north latitude, 56.7 degrees west longitude. The reddish color on land is vegetation.

Photo credit: NASA/GSFC/METI/ERSDAC/JAROS, and U.S./Japan ASTER Science Team

Sunday, April 15, 2012

The Tibetan Plateau


Frozen lakes dotting the Tibetan Plateau in Central Asia are pictured in this image, acquired on 30 January 2012 by ESA’s Envisat satellite.

To its south Tibet is boarded by the Himalayan mountain range – part of which is visible in the lower-left corner of the image. To the northwest, we can see part of the Kunlun mountains, separating the plateau from the Tarim Basin. Both salt- and freshwater lakes are visible across the steppe – many of which freeze for many months of the year.

Photo credit: ESA

Saturday, April 14, 2012

Perpetual Ocean


Driven by wind and other forces, currents on the ocean surface cover our planet. Some span hundreds to thousands of miles across vast ocean basins in well-defined flows. Others are confined to particular regions and form slow-moving, circular pools. Seen from space, the circulating waters offer a study in both chaos and order. The visualization below, based on ocean temperature, salinity, sea surface height and sea ice data collected during field observations and by NASA satellites between July 2005 and December 2007, highlights many of the world's most important ocean surface currents. Watch powerful, fast-moving currents like the Gulf Stream in the Atlantic Ocean and the Kuroshio in the Pacific Ocean carry warm waters northeastward at speeds greater than 4 mph. View coastal currents such as the Agulhas in the Southern Hemisphere transporting equatorial waters from the Indian Ocean farther southwards. Explore the image collection to compare the direction and unique flow pattern of each of these major currents.

Video credit: NASA/Goddard Space Flight Center

Friday, April 13, 2012

Baiyun Ebo, China


A mine in Baiyun Ebo, Inner Mongolia, China is the site of almost half the world's rare earth production. China is responsible for over 95% of global production of rare earth elements. These elements are critical ingredients in catalytic converters, cell phones, televisions, lasers, magnets, batteries, and other high-tech gizmos. China's export restrictions have led the US, Japan and the European Union to complain to the World Trade Organization, claiming China was violating trade agreements. The US at one time was a leading producer of rare earths, but most of the mines have been closed. Recently, several US companies are in the process of attempting to re-open these mines and resume mining of rare earths. The image covers an area of 15 x 19 km, was acquired on June 30, 2006, and is located near 41.8 degrees north latitude, 110 degrees east longitude.

Photo credit: NASA/GSFC/METI/ERSDAC/JAROS, and U.S./Japan ASTER Science Team

Thursday, April 12, 2012

Flooding in Fiji


Fiji was hard hit by heavy rains in early 2012, causing flooding and landslides. Hardest hit was the western part of the main island of Viti Levu, Fiji, and the principal city of Nadi. Thousands of people were displaced and the Disaster Management Office declared a state of emergency. In this simulated natural color image acquired by the Advanced Spaceborne Thermal Emission and Reflection Radiometer (ASTER) instrument on NASA's Terra spacecraft on April 7, 2012, the muddy overflowing Nadi River and its tributaries are seen winding through the city of Nadi. The image covers an area of 10.7 by 12.5 miles (17.3 by 20.1 kilometers), and is located at 17.6 degrees south latitude, 177.7 degrees east longitude.

Photo credit: NASA/GSFC/METI/ERSDAC/JAROS, and U.S./Japan ASTER Science Team

Tuesday, April 10, 2012

The British Isles and the North Atlantic


Flying at an altitude of about 240 miles over the eastern North Atlantic, the Expedition 30 crew aboard the International Space Station photographed this nighttime scene. This view looks northeastward. Center point coordinates are 46.8 degrees north latitude and 14.3 degrees west longitude. The night lights of the cities of Ireland, in the foreground, and the United Kingdom, in the back and to the right, are contrasted by the bright sunrise in the background. The greens and purples of the Aurora Borealis are seen along the rest of the horizon.

This image was taken on March 28, 2012.

Photo credit: NASA

Update: A similar image can be found here.

Monday, April 9, 2012

Dubai


City lights of Dubai, United Arab Emirates, are featured in this image taken by the Expedition 30 crew aboard the International Space Station. The City of Dubai--the largest metropolitan area within the emirate of Dubai--is a favorite subject of astronaut photography largely due to the unique artificial archipelagos situated directly offshore in the Persian Gulf, which were built such that their full design is only visible from the vantage point of an airplane -- or an orbiting spacecraft. The city presents an eye-catching appearance at night that vividly displays the urban development pattern. In this detailed image, taken with a long focal length lens and digital camera optimized for fast response and high light sensitivity, several interesting patterns can be observed. The highways and major streets are sharply defined by yellow-orange lighting, while the commercial and residential areas are resolved into a speckle pattern of individual white, blue and yellow-orange lights. Several large and brilliantly lit areas are large hotel and mall complexes, including the Burj Khalifa Tower, the world's tallest building at 2,717 feet, or 828 meters. The brilliant lighting of the city contrasts sharply with both the dark Persian Gulf to the northwest, and largely undeveloped and unlit areas to the southeast. Likewise, the clusters of lighting in the Palm Jumeira complex at bottom right correspond to the relatively small part of the archipelago that has been developed. Isolated areas of blurred city lights are due to patchy clouds.

Photo credit: NASA

Sunday, April 8, 2012

Melbourne at Night


Melbourne, Australia, at night taken by ESA astronaut André Kuipers from the International Space Station with the NightPod camera aid.

Cameras mounted on NightPod track the movement of Earth as it flies under the Space Station. Night-time photographs are less blurred and captured in higher detail.

Photo credit: ESA/NASA

Saturday, April 7, 2012

Larsen B: 2002-2012


This animation shows radar images from the Envisat satellite from 2002 to 2012 of the Larsen B ice shelf in Antarctica. Over the last decade, the ice shelf has disintegrated by 1790 sq km.

Photo credit: ESA

Friday, April 6, 2012

Bonaire, Curaçao and Aruba


Bonaire, Curaçao and Aruba seen from the International Space Station. This picture was taken by ESA astronaut André Kuipers. A picture of this area was requested via social media. André managed to take the picture and upload it to the Internet two weeks later while onboard the Space Station.
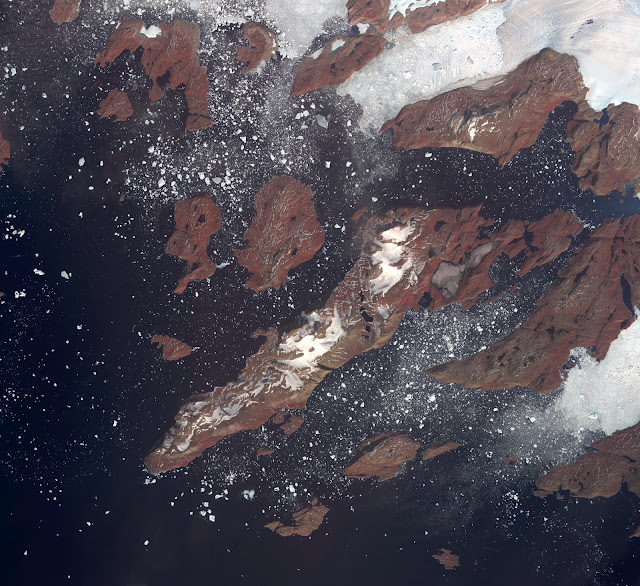
Photo credit: ESA/NASA

Thursday, April 5, 2012

Santo Domingo, Dominican Republic


Santo Domingo is the capital of the Dominican Republic. Founded in 1496 by Christopher Columbus, it is the oldest continuously inhabited European settlement in the Americas, with the America's first cathedral, hospital, customs house and university. The town was laid out in a grid pattern that became the model for almost all town planners in the New World. The image was acquired May 18, 2011, covers an area of 24 x 30 km, and is located at 18.5 degrees north latitude, 70 degrees west longitude.

Photo credit: NASA/GSFC/METI/ERSDAC/JAROS, and U.S./Japan ASTER Science Team

Wednesday, April 4, 2012

Salt Lake in the Australian Outback


The Australian Outback is full of colorful geological structures, such as this salt lake.

This photo was taken by ESA astronaut André Kuipers and released during Earth Hour on Saturday 31 March 2012.

Earth Hour is a world effort to raise awareness about the need to take action on climate change. World Wide Fund for Nature ambassador André Kuipers and ESA supported the initiative.

Photo credit: ESA/NASA

Saturday, March 31, 2012

Night Lights in Europe


This animation is made up of two images of Europe at night showing lights from sources in cities and along roads in 1992 and 2010. Bright areas highly correlate with high population density – such as the densely populated cities like London, Paris and Rome. Coastal areas are also more populated than inland regions, making the outline of Europe clearly visible in these night images.

The images were acquired by the United StatesDMSP satellites. The DMSP satellites are run by the National Oceanic and Atmospheric Administration, monitoring the meteorological, oceanographic and solar–terrestrial physics environments for the US Department of Defense. Data from DMSP’s Operational Linescan System can be used to see city lights.

Photo credit: NGDC/DMSP/ESA

Sunday, March 25, 2012

Indonesian Islands


This image from the Envisat satellite is dominated by the Indonesian islands of Bali, Lombok and Sumbawa. Bali's central mountains include peaks that reach over 3000 m, including an active volcano visible on the right side of the island. Strong reflections of the radar signal used to produce this image appear like specks of light. They are mainly detectable in the southern part of the island, and are particularly concentrated around the provincial capital city of Denpasar. This is the typical appearance of built-up areas in radar images, owing to the multiple reflection of the radar beam by buildings and especially metal constructions.

This image is a compilation of three passes by Envisat’s radar on 20 June, 19 August and 17 December 2011. Each is assigned a color (red, green and blue) and combined to produce this representation. The colors reveal changes in the surface between Envisat’s passes.

Photo credit: ESA