Saturday, June 29, 2013

Vegetation in Syria, Turkey and Iraq


The recently launched Proba-V miniaturized satellite captured this image over the border region of northern Syria, southeastern Turkey and northern Iraq on 28 May. The area pictured is about 500 km across, with large reservoir lakes along the Euphrates River visible on the left, and another along the Tigris River on the right. In the central-right portion of the image, we can see Iraq’s Sinjar mountains. Proba-V will map land cover and vegetation growth across the entire planet every two days with its Vegetation imager. In this image, the contrast between the green areas – some with agricultural plots – and the sparsely vegetated areas is evident. It demonstrates Proba-V’s ability to see slight differences in vegetation cover. Vegetation intensity and health can help in crop yield predictions and to map interannual changes in vegetation cover.

This image is featured on the Earth from Space video program.

Photo credit: ESA

Wednesday, June 26, 2013

Sunday, June 23, 2013

Carstens, California Wildfire


The Carstens, California, wildfire continues to burn in the foothills west of Yosemite National Park. As of June 21, 2013, the fire had consumed 1,660 acres, and was 70 percent contained. In this image, acquired by the Advanced Thermal Emission and Reflection Radiometer (ASTER) instrument on NASA's Terra spacecraft, vegetation is displayed in green and burned and bare areas are dark to light gray. The data were acquired on June 20, 2013, and cover an area of 16 by 24 miles (26 by 39 kilometers).

Image credit: NASA/GSFC/METI/ERSDAC/JAROS, and U.S./Japan ASTER Science Team

Saturday, June 22, 2013

Barcelona, Spain


The Spanish city of Barcelona is pictured in this image captured on 13 September 2010 by Japan’s ALOS satellite. Near the top right corner, the circular Plaça de les Glòries Catalanes was meant to be the city center in the original urban plan. Dominating the left side of the image are the Garraf Massif mountains, their cliffs reaching the Mediterranean coast. Rock quarries and rubbish dumps are degrading the land here, and some of these degraded areas can be seen in the lower left corner as large yellow patches. Along the coast, we can see the Barcelona’s port – one of Europe’s top ten largest container ports. Barcelona-El Prat airport is about 10 km southwest of the city center, across the Llobregat River. On either side of the airport we can see the darker areas of the Llobregat delta.

Photo credit: JAXA/ESA

Saturday, June 15, 2013

Rates of Basal Melt of Antarctic Ice Shelves


Rates of basal melt of Antarctic ice shelves (melting of the shelves from underneath) overlaid on a 2009 mosaic of Antarctica created from data from NASA's Moderate Resolution Imaging Spectroradiometer (MODIS) instrument aboard NASA's Terra and Aqua spacecraft. Red shades denote melt rates of less than 5 meters (16.4 feet) per year (freezing conditions), while blue shades represent melt rates of greater than 5 meters (16.4 feet) per year (melting conditions). The perimeters of the ice shelves in 2007-2008, excluding ice rises and ice islands, are shown by thin black lines. Each circular graph is proportional in area to the total ice mass loss measured from each ice shelf, in gigatons per year, with the proportion of ice lost due to the calving of icebergs denoted by hatched lines and the proportion due to basal melting denoted in black.

Image credit: NASA/JPL-Caltech/UC Irvine/Columbia University

Note: For more information, see Warm Ocean Causing Most Antarctic Ice Shelf Mass Loss

Friday, June 14, 2013

New Zealand's South Island


New Zealand’s South Island is pictured in this Envisat image from 4 April 2012. There are a number of lakes throughout the island, but one that stands out in particular is Lake Pukaki, at the center of the image. The bright blue coloring of its waters comes from the extremely fine rock particles fed into the water from the glaciers. To the northeast, the light green coloring of Lake Ellesmere / Te Waihora can be seen. Peeking out from between the clouds to the south is Stewart Island/Rakiura – the country’s third largest island.

This image is featured on the Earth from Space video program.

Photo credit: ESA

Tuesday, June 11, 2013

Arctic Permafrost Zones


Permafrost zones occupy nearly a quarter of the exposed land area of the Northern Hemisphere. NASA's Carbon in Arctic Reservoirs Vulnerability Experiment is probing deep into the frozen lands above the Arctic Circle in Alaska to measure emissions of the greenhouse gases carbon dioxide and methane from thawing permafrost - signals that may hold a key to Earth's climate future.

Image credit: Hugo Ahlenius, UNEP/GRID-Arendal

Note: For more information, see Is a Sleeping Climate Giant Stirring in the Arctic? Also, Is Arctic Permafrost the "Sleeping Giant" of Climate Change?

Thursday, June 6, 2013

Botswana's Okavango Delta


This image is a compilation of three images from Envisat’s radar and shows where southwestern Africa’s Okavango River empties into the inland Okavango Delta in northern Botswana. The Okavango River originates in Angola, forms part of the Angola Namibia border and then ends in northern Botswana. Here, it has formed a depression in the semi-arid Kalahari basin. Appearing purple at the center of the image is Chief’s Island. In the lower-right portion of the image we can see a large cluster of radar reflections from the town of Maun. At the top of the image, a triangle with similar coloring to the delta can be seen. This is a swamp area and national park located mostly in Namibia.

This image is featured on the Earth from Space video program.

Image credit: ESA

Wednesday, June 5, 2013

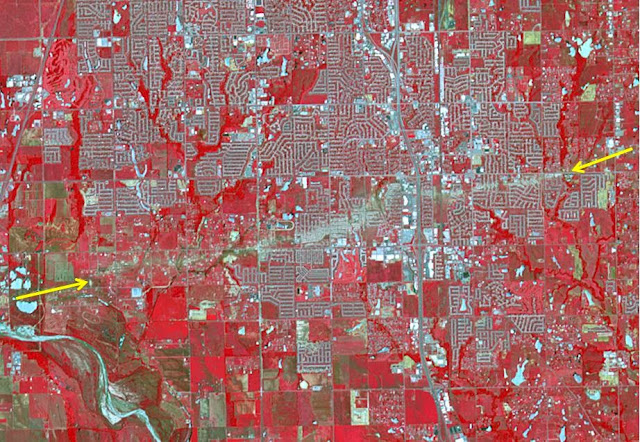
Path of the Newcastle-Moore, Oklahoma EF-5 Tornado


The Newcastle-Moore EF-5 tornado ripped through central Oklahoma on May 20, 2013, killing 24 people and leaving behind more than $2 billion in damage. On June 2, 2013, the Advanced Spaceborne Thermal Emission and Reflection Radiometer (ASTER) instrument on NASA's Terra spacecraft captured this image showing the scar left on the landscape by the tornado's deadly track. In this false-color image, vegetation is red, water is dark blue, roads and buildings are gray and white, and bare fields are tan. The tornado track crosses the image from left to right as indicated by the arrows. The image covers an area of 6 by 8.6 miles (9.6 by 13.8 kilometers), and is located at 35.3 degrees north latitude, 97.5 degrees west longitude.

Image credit: NASA/GSFC/METI/ERSDAC/JAROS, and U.S./Japan ASTER Science Team

Note: For more information, see NASA Spacecraft Sees Tornado's Destructive Swath.